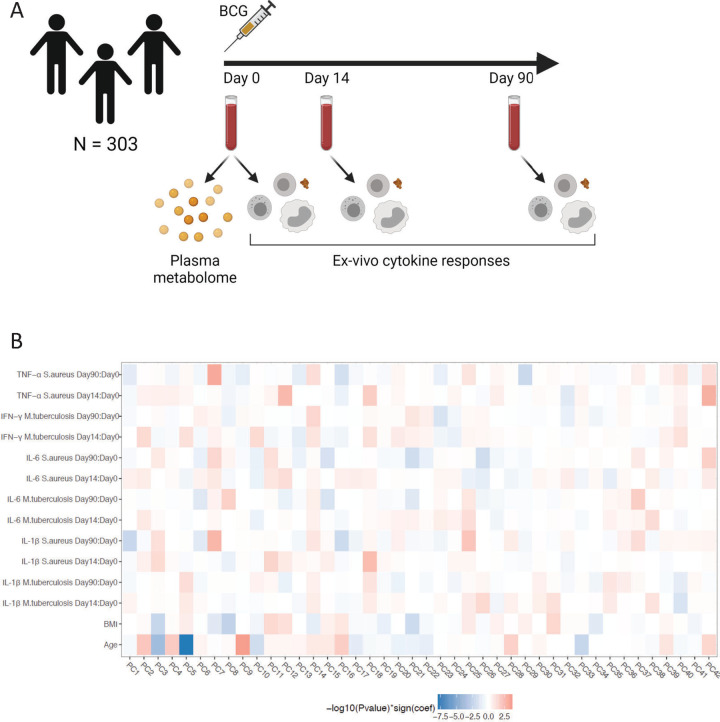
Fig 1. Study overview and correlation between circulating metabolome and ex vivo cytokine responses upon BCG vaccination.
(A) Schematic overview of the study. Created with BioRender.com. (B) Heatmap of hierarchical clustering on Spearman correlation patterns between metabolites and PBMC-derived S. aureus-induced IL-1β, IL-6, and TNF-α responses and M. tuberculosis-induced IL-1β, IL-6, and IFN-γ responses. The ex vivo cytokine responses are analyzed as fold changes between baseline (v1, day 0) and 2 weeks (v2, day 14) and 3 months (v3, day 90) after BCG vaccination. The metabolites are represented as the top 42 PCs, capturing 75.3% of the variance. Cell colors indicate −log10(p-value) multiplied by the correlation coefficients from negative (blue) to positive (red). The metadata on study participants, metabolome, and cytokine data used to generate this figure are available at https://gitlab.com/xavier-lab-computation/public/bcg300. The loadings of the top 10 metabolites of the top 10 PC’s can be found in S1 Table. BCG, Bacillus Calmette–Guérin; PC, principal component; PBMC, peripheral blood mononuclear cell.

