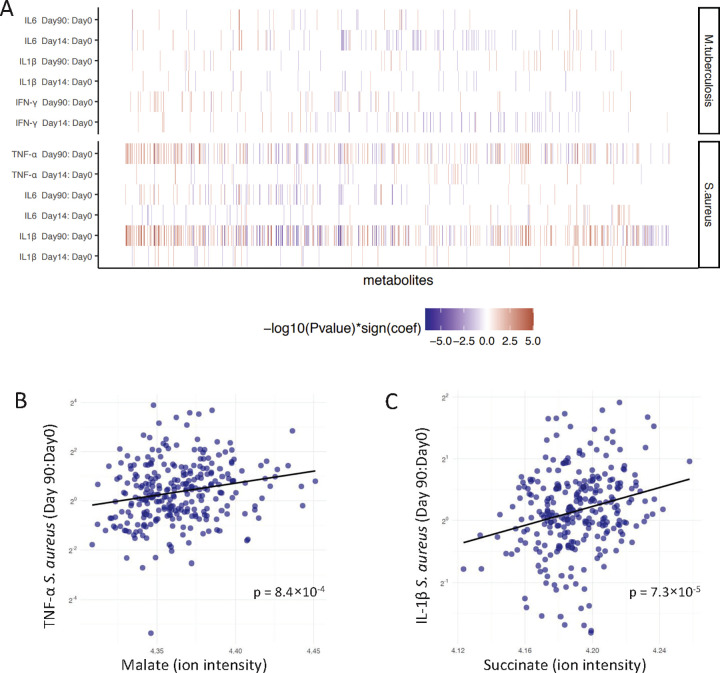
Fig 2. Association between baseline metabolites and ex vivo cytokine responses upon BCG vaccination.
(A) Baseline metabolites were associated with fold changes of PBMC-derived S. aureus-induced IL-1β, IL-6, and TNF-α responses and M. tuberculosis-induced IL-1β, IL-6, and IFN-γ responses corrected for age and sex. Fold changes were calculated 2 weeks (v2, day 14) or 3 months (v3, day 90) after BCG vaccination compared to baseline (v1, day 0). Only metabolites with a significant association to one of the cytokine-stimulus pairs are depicted in this figure (N = 777, p < 0.05). The metabolites are ordered by hierarchical clustering. Cell colors indicate significant associations as −log10(p-value) multiplied by the correlation coefficients from negative (blue) to positive (red). The summary statistics of top 10 associated metabolites per stimulation can be found in S2 Table. (B) Linear regression between malate at baseline and fold changes of ex vivo PBMC-derived S. aureus-induced TNF-α responses 3 months after vaccination. (C) Linear regression between succinate at baseline and fold changes of ex vivo PBMC-derived S. aureus-induced IL-1β responses 3 months after vaccination. The metadata on study participants, metabolome, and cytokine data used to generate these figures are available at https://gitlab.com/xavier-lab-computation/public/bcg300. BCG, Bacillus Calmette–Guérin; PBMC, peripheral blood mononuclear cell.

