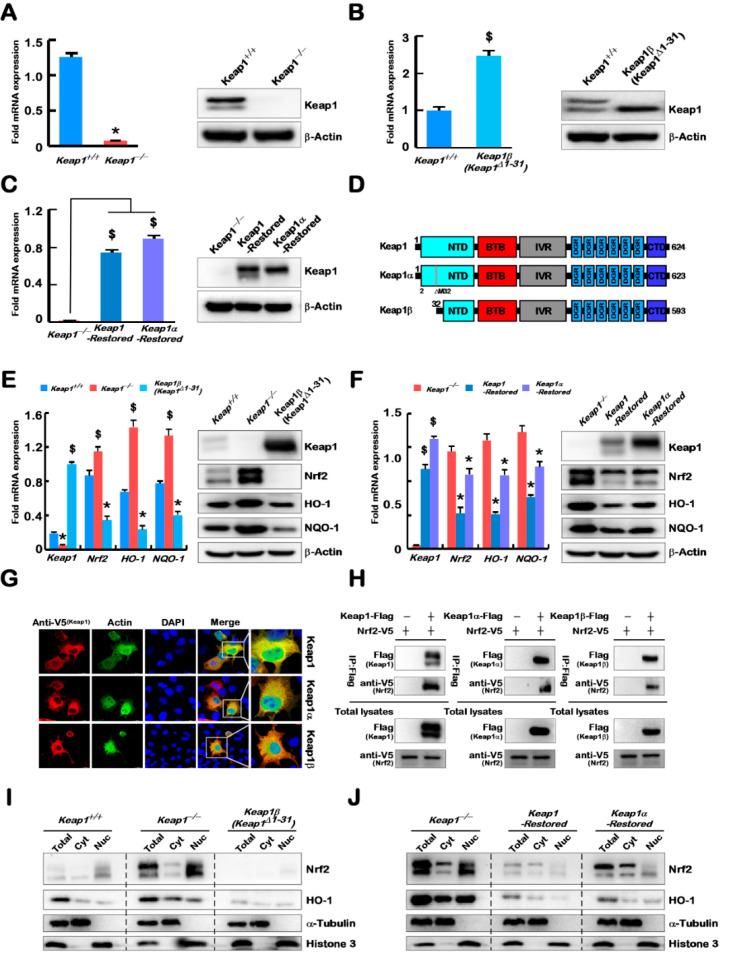
Figure 1.
Construction of model cell lines with differential expression of Keap1 and its isoforms α and β. (A–C) Identification of Keap1−/− (A), Keap1β(Keap1Δ1–31) (B), Keap1-Restored (C), and Keap1α-Restored (C) cell lines by real-time qPCR and Western blotting. (D) Schematic representation of Keap1 and its isoform with distinct domains. When compared with Keap1, Keap1α lacks the 2nd translation starting codon (ATG, encoding the 32nd amino acid), whilst Keap1β lacks the first N-terminal 31 amino acids. (E,F) The mRNA and protein expression levels of Keap1, Nrf2, HO-1, and NQO-1 were determined in Keap1+/+, Keap1−/− and Keap1β(Keap1Δ1–31) cell lines (E), and also examined in Keap1−/−, Keap1-Restored, and Keap1α-Restored cell lines (F). (G) Subcellular localisation of Keap1 and its isoforms α and β in COS-1 cells that had been transfected with Keap1-V5, Keap1α-V5 or Keap1β-V5 plasmids, respectively. Then immunocytochemistry was performed by incubating the cells with primary antibody and fluorescent secondary antibody, before being stained with DAPI. A flag-tagged primary antibody against endogenous Actin was used as a control. The fluorescence intensity of indicated proteins was measured and observed by an immunofluorescence microscope. The images showed a representative of three independent experiments. Scale bars = 20 µm. (H) Interaction of Nrf2 with Keap1 and its isoforms α and β was verified by the co-immunoprecipitation (CO-IP) analysis of HepG2 cells that had been co-transfected with Nrf2 and each expression construct for Keap1, Keap1α or Keap1β, respectively. After transfection for 8 h and recovery for 24 h, the total proteins were collected and subjected to CO-IP assays. The resulting immunoprecipitates, along with total cell lysates, were analysed by immunoblotting with the indicated antibodies. (I,J) Subcellular fractionation of Nrf2 together with Keap1 and its isoforms α and β. The cytoplasmic and nuclear fractions were isolated from five distinct cell lines and visualised by Western blotting with antibodies against Nrf2, HO-1, and α-tubulin and histone3. Statistically significant increases ($) or decreases (*) were indicated by p ≤ 0.01 (n ≥ 3, or =3 × 3).

