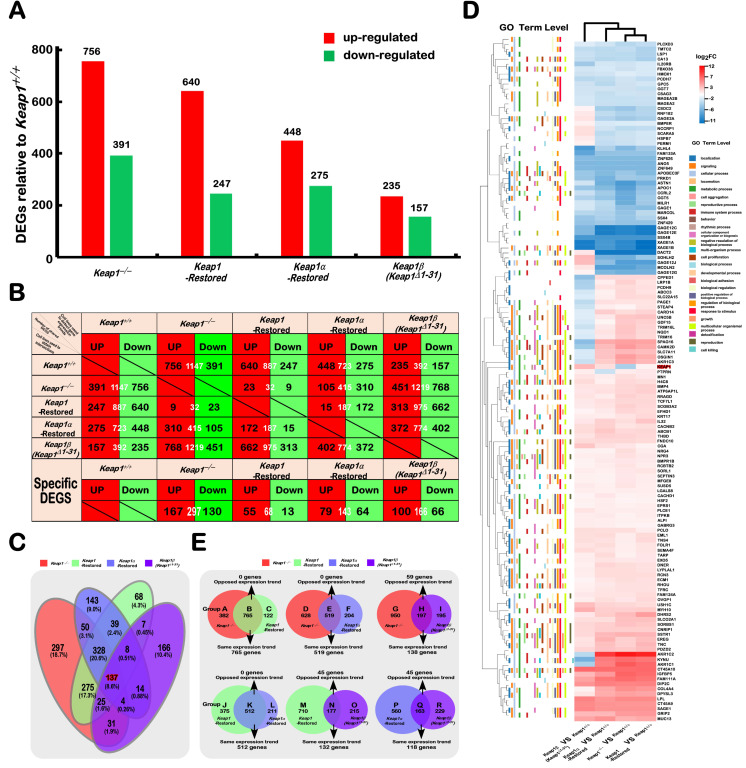
Figure 2.
Statistical analysis of the data obtained from transcriptome sequencing. (A) The differentially expressed genes (DEGs) of distinct cell lines were analysed by transcriptome sequencing, and the increase or decrease in DEGs was presented in the form of a histogram The DEGs were selected according to the following criteria: fold changes of ≥2 or ≤0.5 and FDR ≤ 0.001 (as compared to those obtained from control cells). (B) The specific DEGs in each cell line and their common DEGs between every two cell lines were also counted as indicated in the chart, and the number of increased and decreased DEGs in each group is shown separately in black font, and the total is shown in white. In addition, the change trends of DEGs in each group were indicated in red or green, which represent upregulated or downregulated in the cells (in the first row), respectively. (C) The common or unique DEGs among sequenced samples were exhibited in the Venn chart. (D) The heatmap with hierarchical clustering of 137 DEGs was shared in all four cells lines, when compared to the data of Keap1+/+ cell lines. (E) Venn diagrams represent those common and differentially expressed genes between every two cells.

