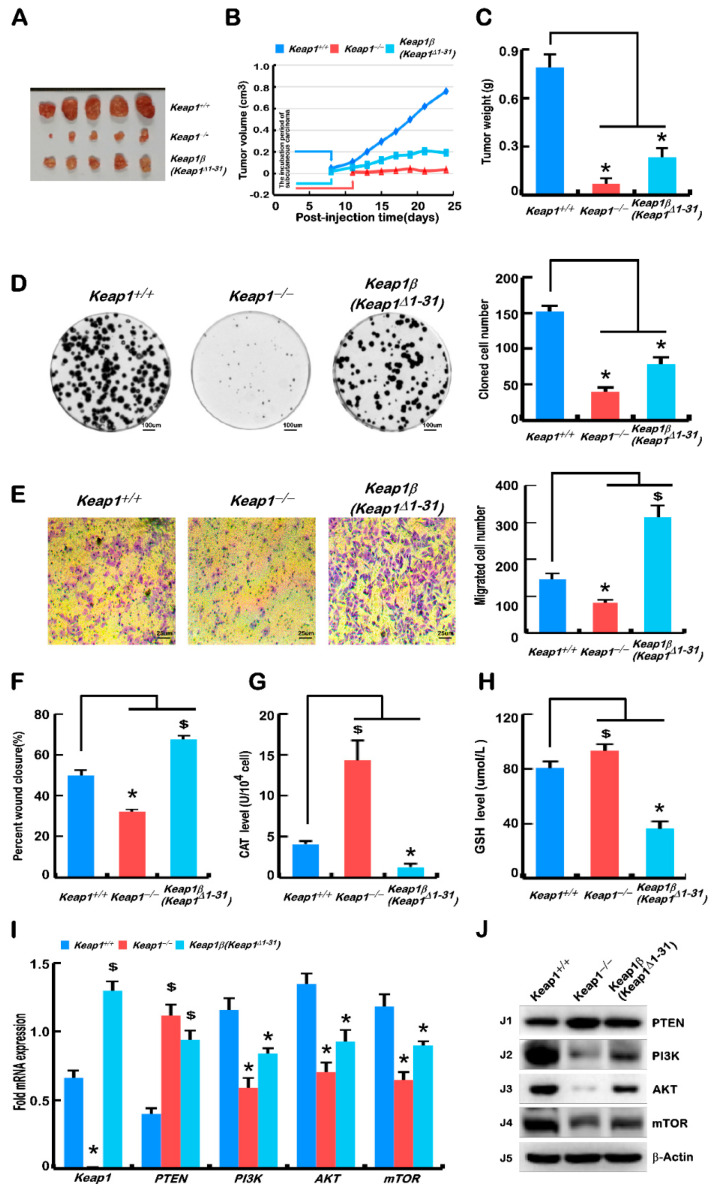
Figure 3.
Knockout of Keap1 is a more potent player than Keap1β(Keap1Δ131) at preventing tumour xenografts in nude mice. (A) Keap1+/+, Keap1−/− and Keap1β(Keap1Δ131) cell lines were, respectively, injected subcutaneously in each group of five nude mice, and their tumours were fetched out after growing for 25 days. (B) Tumour growth curves of Keap1+/+, Keap1−/− and Keap1β(Keap1Δ131)-derived carcinomas in subcutaneous tissues of nude mice within 25 days. (C) These tumour weights were measured after removal from the subcutaneous tumour-bearing loci of nude mice. (D) Cell proliferation was calculated by counting the colony-forming units. Equal amounts of Keap1+/+, Keap1−/−, and Keap1β(Keap1Δ1–31) cell lines were cultured in each capsule, and 10 days later, their corresponding clones was quantified. (E) The number of those cells migrated across the Transwell membrane in Keap1+/+, Keap1−/−, and Keap1β(Keap1Δ1–31) cell lines were calculated, after the polycarbonate film stained with crystal violet was photographed on an inverted microscope. (F) Wound healing was assessed according to the scratch width, as also shown in Figure S10A,B. The cell mobility of each of the indicated lines was calculated at 24 h, 48 h, and 72 h. (G) The enzymatic activity of CAT in Keap1+/+, Keap1−/−, and Keap1β(Keap1Δ1–31) cell lines was determined according to the manufacturer’s instruction. (H) The intracellular GSH levels of Keap1+/+, Keap1−/−, and Keap1β(Keap1Δ1–31) cell lines were measured according to the relevant instruction. (I) The mRNA expression levels of Keap1, PTEN, PI3K, AKT1, and mTOR in Keap1+/+, Keap1−/−, and Keap1β(Keap1Δ1–31) cell lines were determined by real-time qPCR. (J) The protein abundances of Keap1, PTEN, PI3K, AKT1, and mTOR expressed in Keap1+/+, Keap1−/−, and Keap1β(Keap1Δ1–31) cell line were visualized by Western blotting. Statistically significant increases ($) or decreases (*) were indicated by p ≤ 0.01 (n ≥ 3, or =3 × 3).

