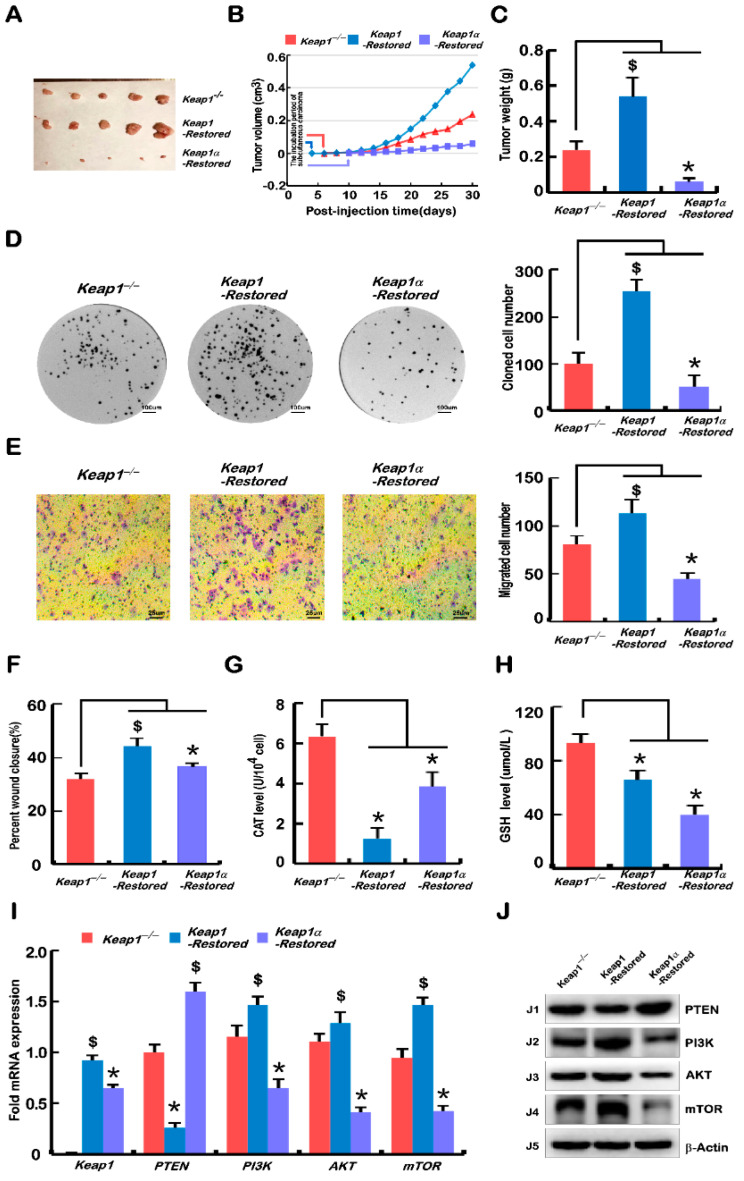
Figure 4.
Malgrowth of Keap1−/−-derived hepatoma cells were significantly suppressed by restoration of Keap1α, but the Keap1-Restored can promote their growth. (A) Subcutaneous tumour formation in nude mice. Keap1−/−, Keap1-Restored, and Keap1α-Restored cell lines were injected subcutaneously in grouped nude mice, and 30 days later the tumours were fetched out. (B) Tumour growth curves of Keap1−/−, Keap1-Restored, and Keap1α-Restored cells in subcutaneous tissues of nude mice within 30 days. (C) The tumours were excised from the subcutaneous carcinomas loci in nude mice and then weighed. (D) Cell proliferation was detected by the colony-forming unit assays. The equal amounts of Keap1−/−, Keap1-Restored, and Keap1α-Restored cell lines were cultured in a capsule, and 10 days later the corresponding number of clones in each dish was recorded. (E) Transwell migration was assayed. The polycarbonate film stained with crystal violet was photographed on an inverted microscope. The number of cells migrated across the membrane in Keap1−/−, Keap1-Restored, and Keap1α-Restored cell lines were calculated. (F) Wound healing was assayed according to the scratch width in Figure S12A,B, before the mobility of each cell was calculated at 24 h, 48 h, and 72 h. (G) Measure of the CAT activity in Keap1−/−, Keap1-Restored, and Keap1α-Restored cell lines according to the kit instruction. (H) Determination of the intracellular GSH levels in Keap1−/−, Keap1-Restored, and Keap1α-Restored cell lines according to the instruction. (I) Real-time qPCR analysis of the mRNA expression levels of Keap1, PTEN, PI3K, AKT1, and mTOR in Keap1−/−, Keap1-Restored, and Keap1α-Restored cell lines. (J) Western blotting examination of the protein abundances of Keap1, PTEN, PI3K, AKT1, and mTOR in Keap1−/−, Keap1-Restored, and Keap1α-Restored cell lines. Statistically significant increases ($) or decreases (*) were indicated by p ≤ 0.01 (n ≥ 3, or =3 × 3).

