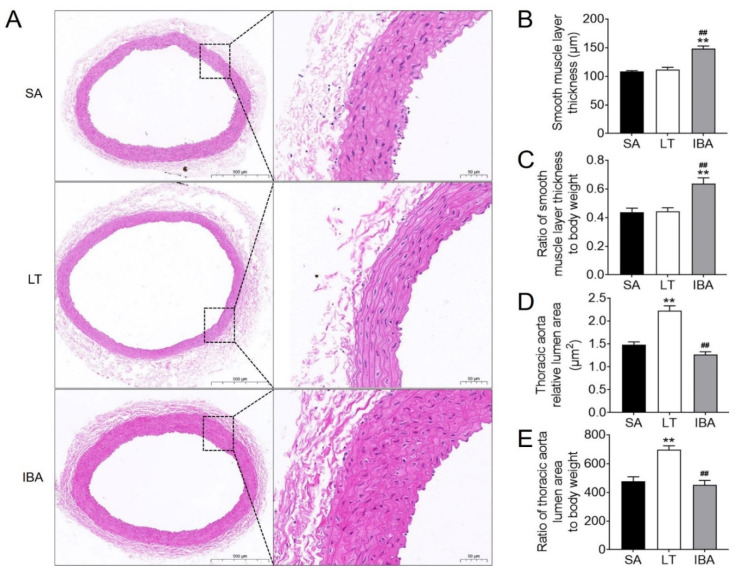
Figure 3.
HE staining of the thoracic aorta in ground squirrels. (A) Typical images of HE staining. The scale in the left column is 500 μm and the scale in right column is 50 μm. (B) Smooth muscle layer thickness was measured at three random locations in each thoracic aorta. (C) The ratio of the mean value of smooth muscle layer thickness to body weight was determined for three random locations in each thoracic aorta. (D) Lumen area of the thoracic aorta. (E) Ratio of lumen area of thoracic aorta to body weight. SA: summer active, LT: late torpor, IBA: interbout arousal. Mean ± SEM. n = 6. Significant a difference from SA conditions is denoted as ** p < 0.01, whereas a significant difference in IBA as compared with LT is denoted by ## p < 0.01.

