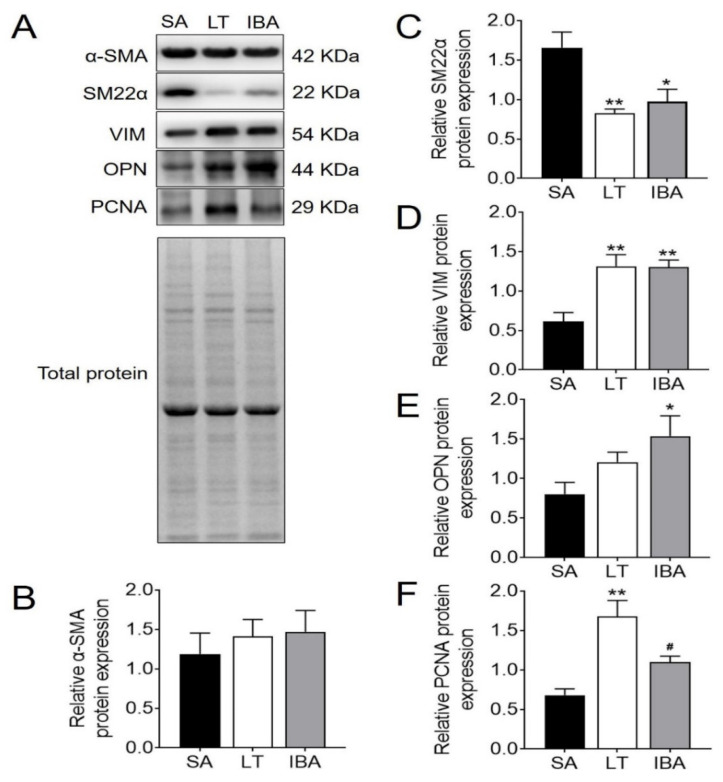
Figure 4.
Expression levels of phenotype-switching related proteins in thoracic aortic SMCs. (A) Typical Western blot images of phenotype-switching related proteins in thoracic aortic SMCs. (B) Protein expression statistics of α-SMA in thoracic aortic smooth muscle. (C) Protein expression statistics of SM22α in thoracic aortic smooth muscle. (D) Protein expression statistics of VIM in thoracic aortic smooth muscle. (E) Protein expression statistics of OPN in thoracic aortic smooth muscle. (F) Protein expression statistics of PCNA in thoracic aortic smooth muscle. SA: summer active, LT: late torpor, IBA: interbout arousal. Mean ± SEM. n = 5. Significant differences between SA conditions are denoted as follows: * p < 0.05, ** p < 0.01, whereas significant differences in IBA as compared with LT are denoted by # p < 0.05.

