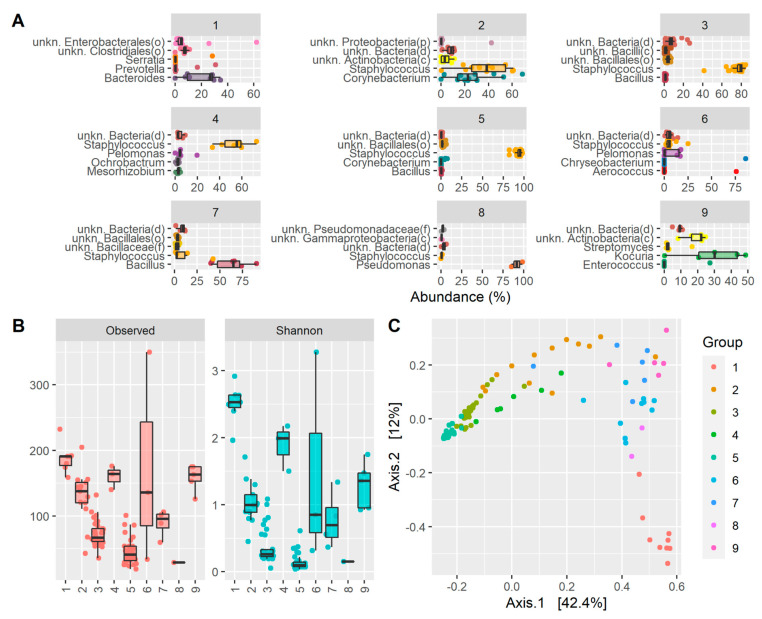
Figure 4.
Drivers of ECST classification and diversity metrics: (A) box plots showing the top five most abundant genera in each ECST; (B) box plots showing the alpha diversity (observed genera and Shannon) for each ECST; (C) principal coordinate analysis (PCoA) from Bray-Curtis beta diversity values colored via eECST.

