Figure 3.

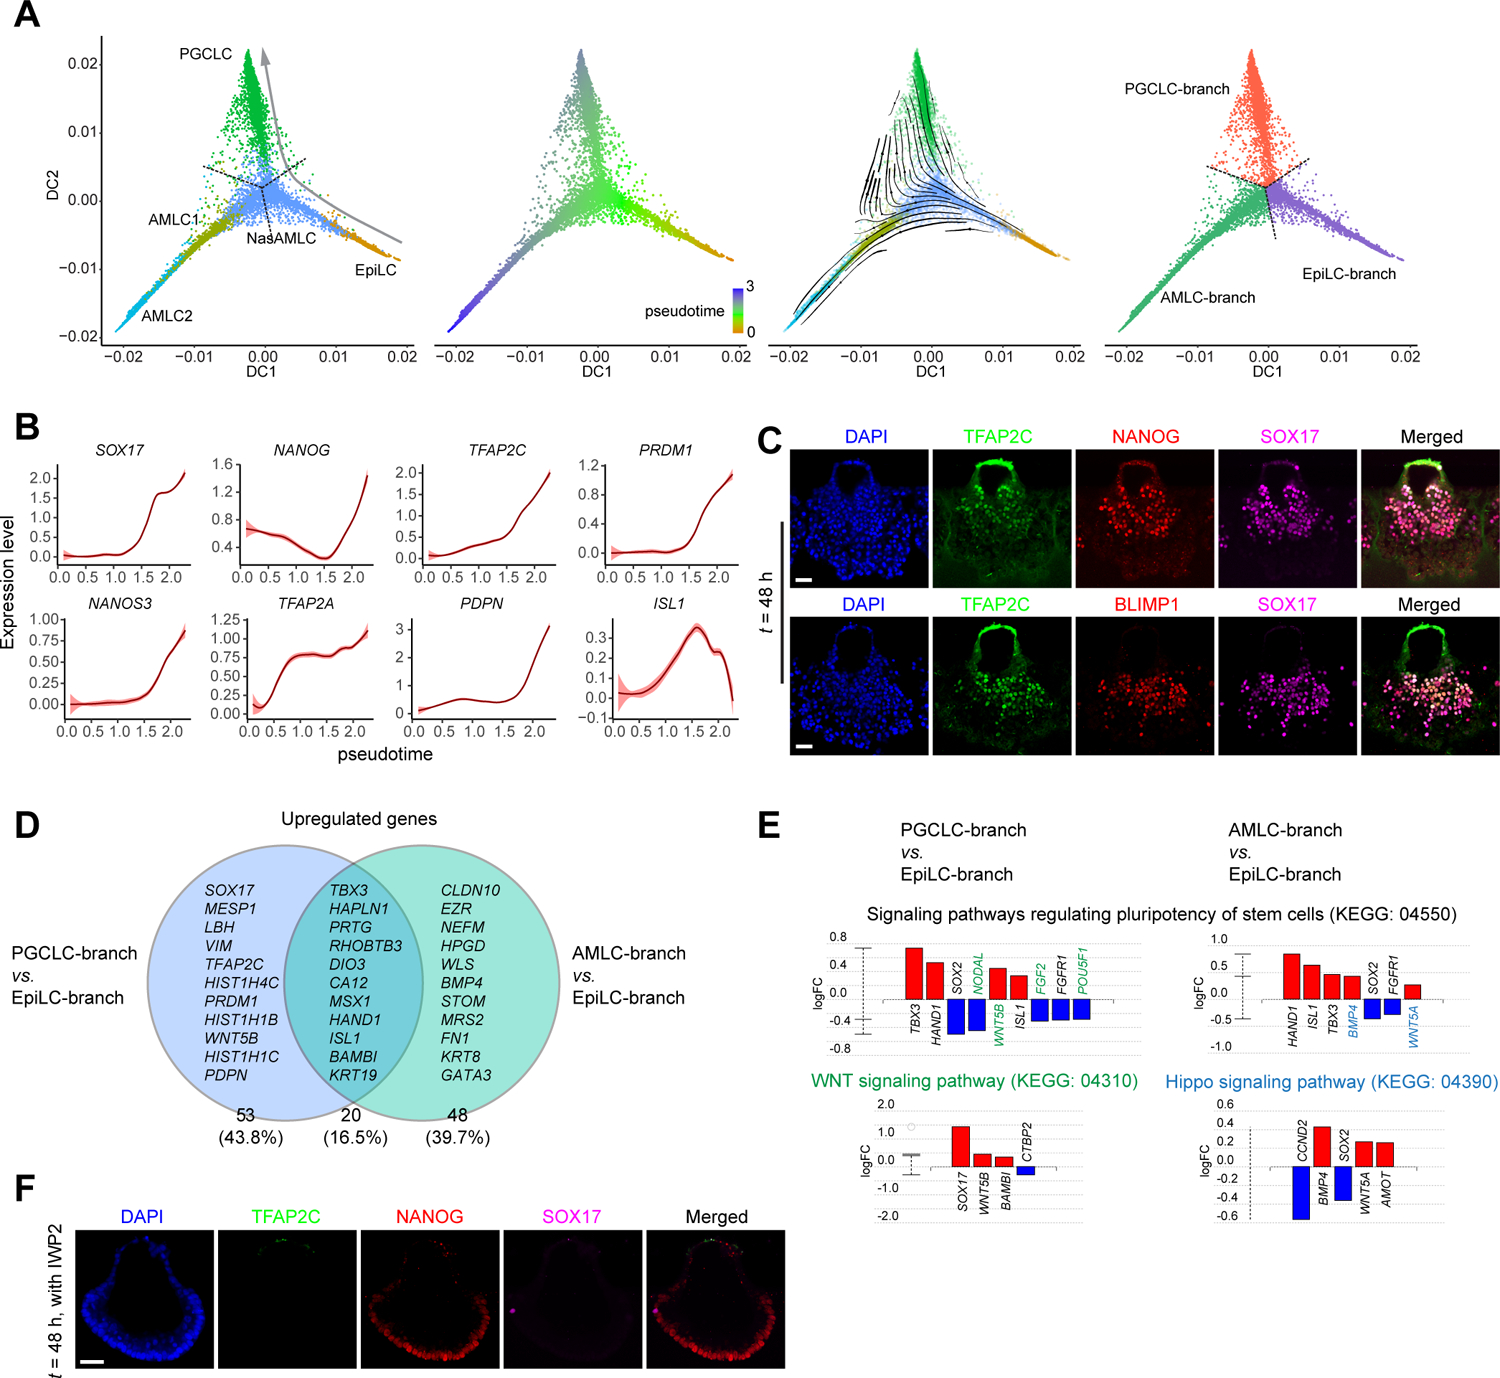
PGCLC specification during μPASE development. (A) Trajectory inference of PGCLC lineage. left: Diffusion map using EpiLC, NasAMLC, AMLC1, AMLC2, and PGCLC clusters from the UMAP plot in Figure 1D. Dotted lines show the branching point and branches identified by K-Branches algorithm. middle left: Pseudotime analysis based on the diffusion map. middle right: RNA velocity vectors overlaid on the diffusion map. right: Branches and the branching point identified by K-Branches algorithm. Note that NasAMLC cluster is separated into three branches, which after merging with EpiLC, AMLC1/2 and PGCLC, respectively, are annotated as EpiLC-branch NasAMLC, AMLC-branch NasAMLC and PGCLC-branch NasAMLC, respectively.
(B) Expression dynamics (pseudotime) of selected genes during PGCLC lineage development. Level of confidence (0.95) is indicated by band width.
(C) Representative confocal micrographs showing μPASEs at t = 48 h stained for TFAP2C, NANOG and SOX17 (top) and TFAP2C, BLIMP1 and SOX17 (bottom).
(D) Venn diagram showing upregulate genes of AMLC-branch and PGCLC-branch NasAMLCs when compared to EpiLC-branch NasAMLCs. Note that only a subset of these genes is specified in the diagram.
(E) Pathway analysis of DEGs in PGCLC-branch NasAMLCs and AMLC-branch NasAMLCs, as compared to EpiLC-branch NasAMLCs. Green and blue colors indicate genes or pathways identified only for PGCLC-branch NasAMLCs and AMLC-branch NasAMLCs, respectively.
(F) Representative confocal micrographs showing μPASEs at t = 48 h stained for TFAP2C, NANOG and SOX17, with IWP2 supplemented into the basal medium from t = 0 h.
In C and F, experiments were repeated four times with similar results. Nuclei were counterstained with DAPI. Scale bars, 50 μm.
