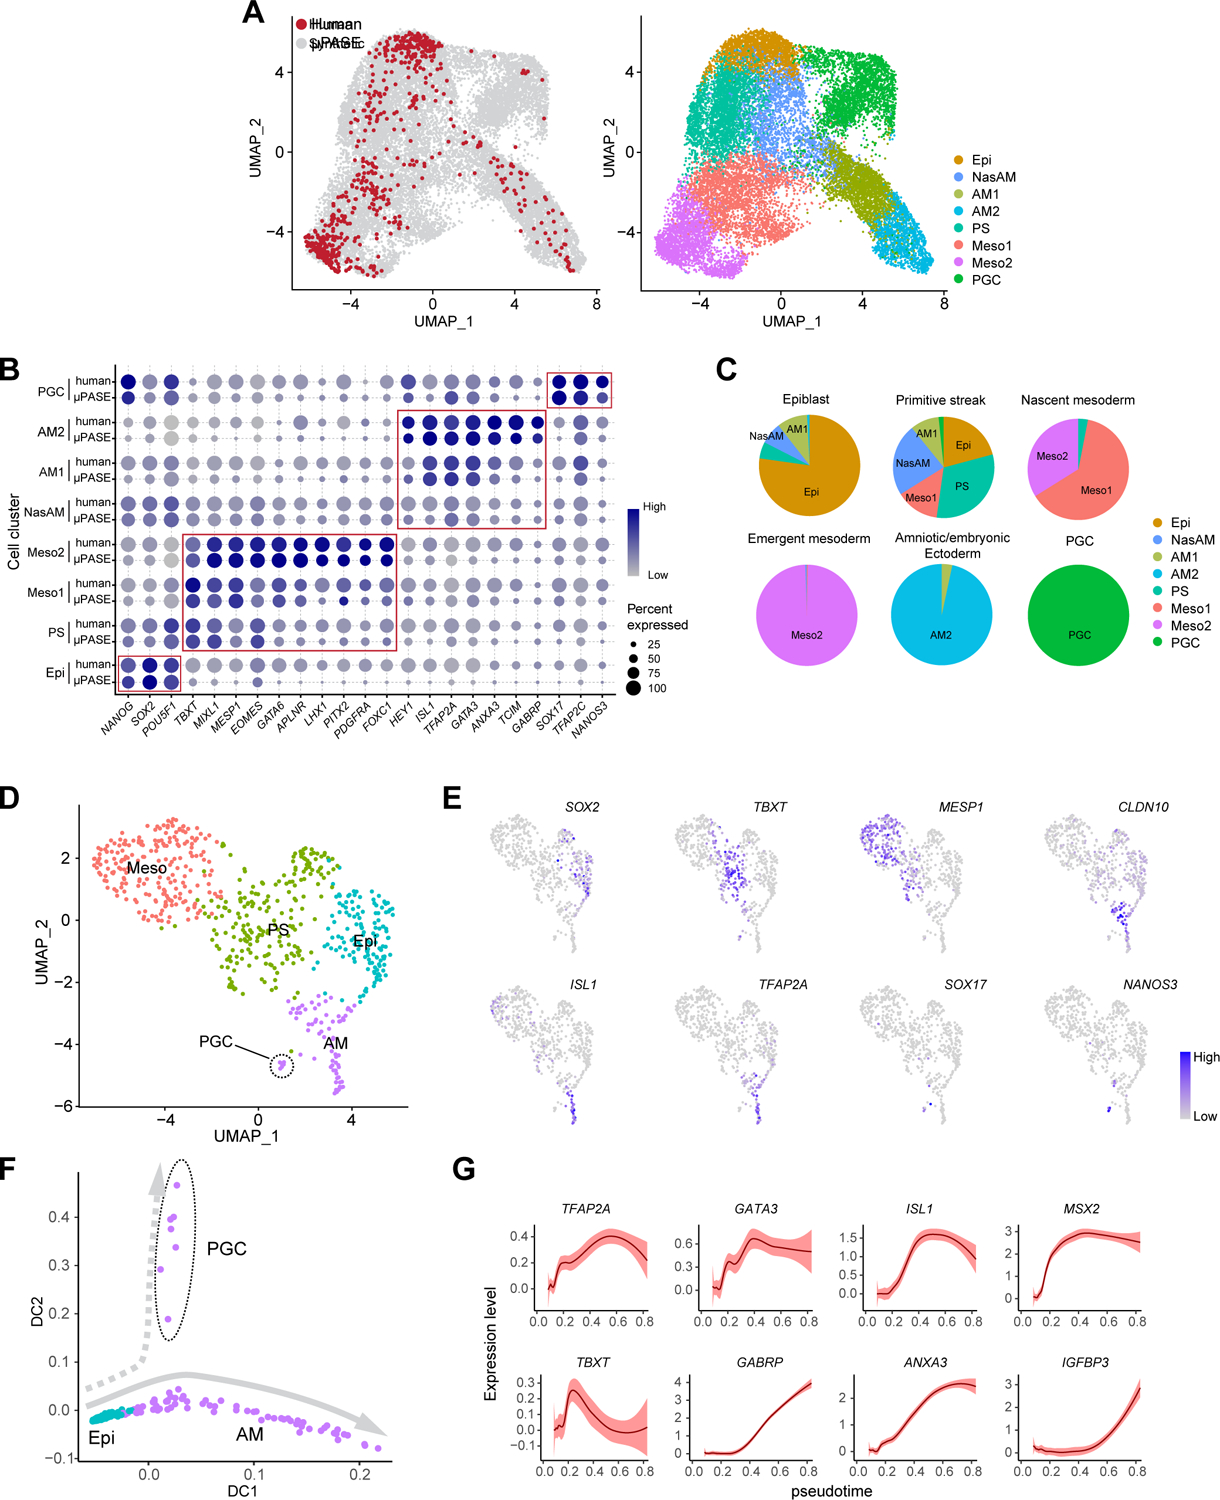
Figure 4. Transcriptomic comparison between μPASEs and Carnegie Stage 7 human gastrula.

(A) left: UMAP of integrated dataset of μPASEs from t = 24, 36 and 48 h (18,335 cells; grey) and CS7 human gastrula (647 cells, excluding irrelevant cells; red). right: UMAP project of integrated dataset with cell identity annotations.
(B) Dot plot comparing expression of key marker genes across different cell clusters from μPASEs and CS7 human gastrula as indicated. The sizes and colors of dots indicate the proportion of cells expressing the corresponding genes and their averaged scaled values of log-transformed expression, respectively.
(C) Comparisons between human gastrula cell annotations in the original publication and annotations in the integrated dataset. The original annotations are indicated above the pie charts. See Mendeley Data Table5
(D) Re-analysis of related cells from CS7 human gastrula (647 cells). Cell identity annotations are color coded as indicated. Note that primordial germ cells (PGCs) appear in the amniotic/embryonic ectoderm (AM) cluster.
(E) Feature plots showing expression of selected lineage markers used for cell cluster annotations in (D).
(F) Trajectory inference (diffusion map) of the AM cluster (including PGCs) in (D).
(G) Expression dynamics (pseudotime) of selected genes during AM lineage development. Level of confidence (0.95) is indicated by band width.
Epi: Epiblast; PS: primitive steak; Meso: Mesoderm; AM: amniotic ectoderm; PGC: primordial germ cell.
