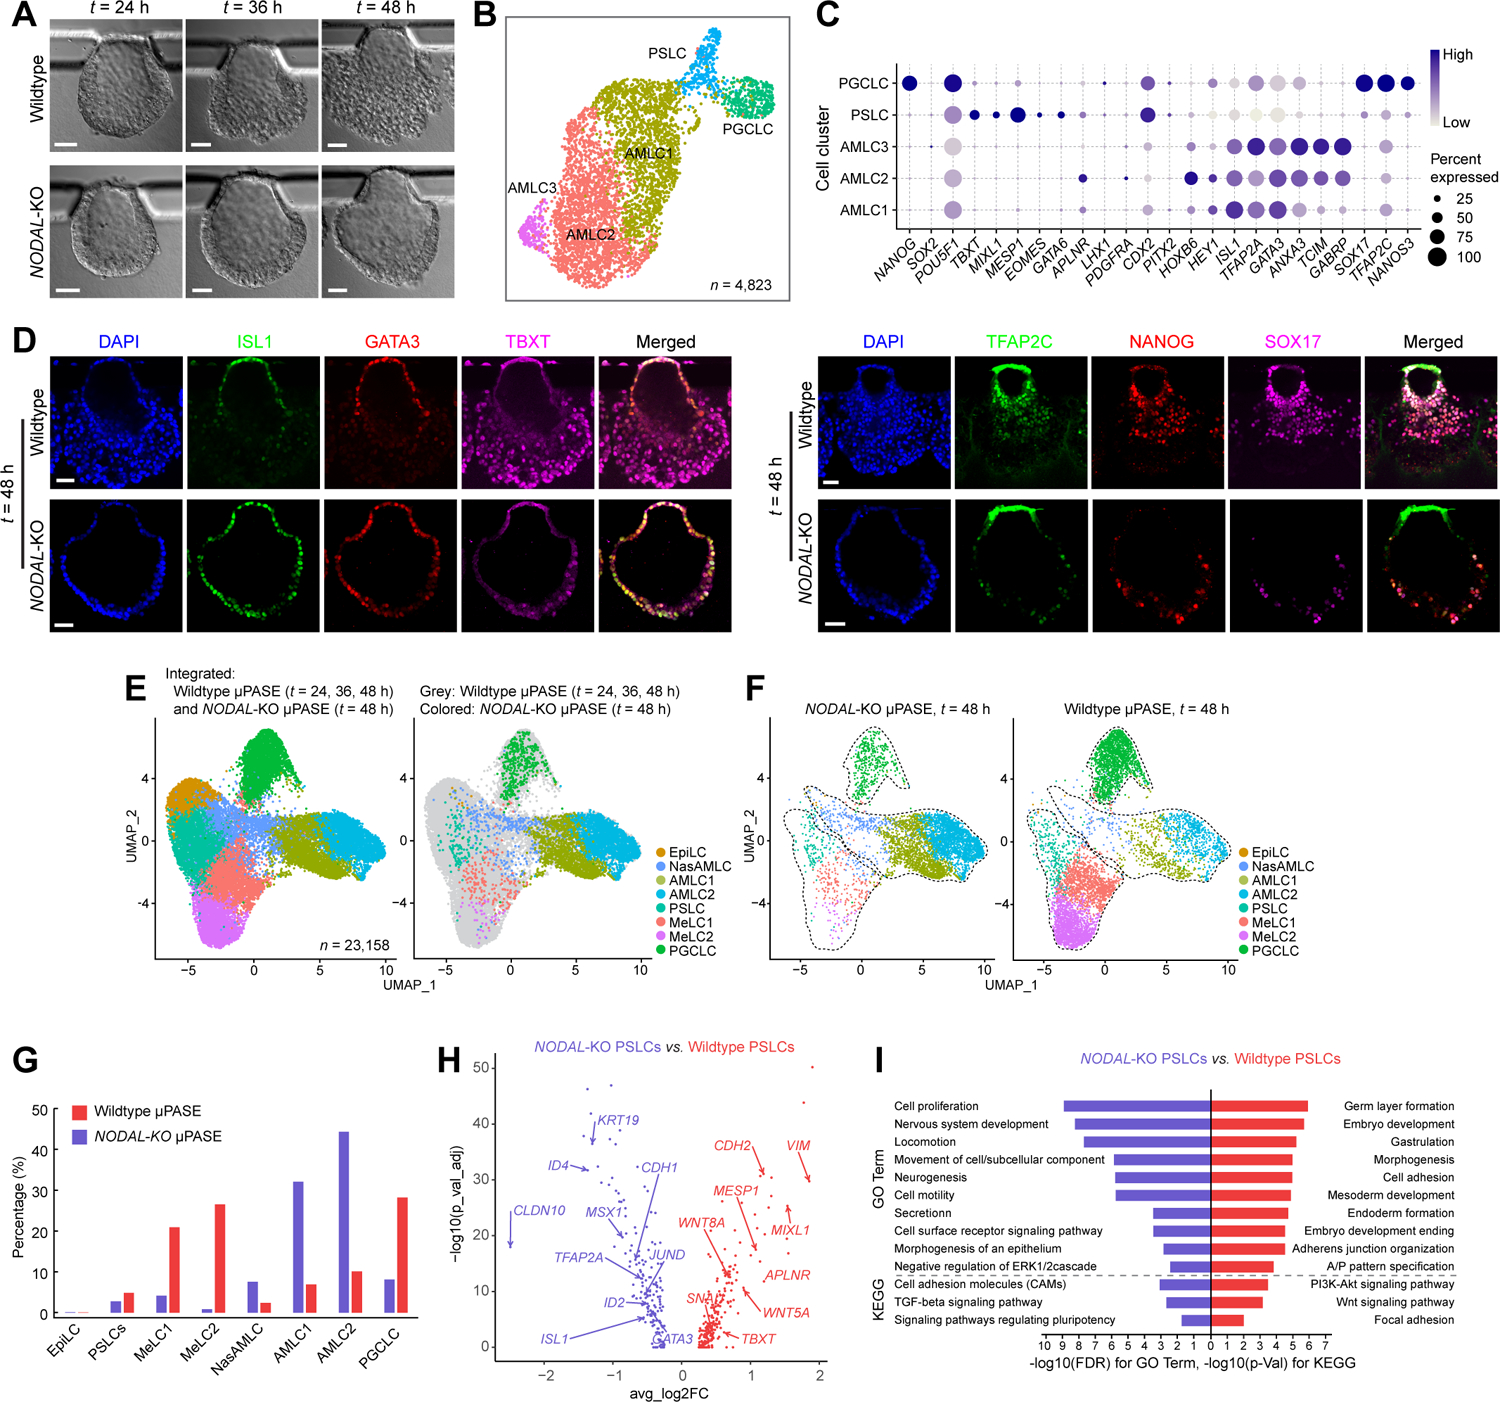
Figure 6. NODAL is essential for mesoderm development in μPASEs.

(A) Representative bight-field images showing progressive development of μPASEs generated from wildtype (top) and NODAL-KO (bottom) hPSCs.
(B) UMAP plot of single-cell transcriptome data from NODAL-KO μPASEs at t = 48 h, with cell identity annotations color coded. n indicates the total cell number.
(C) Dot plot showing expression of key marker genes across the cell clusters in NODAL-KO μPASEs as indicated. The sizes and colors of dots indicate the proportion of cells expressing the corresponding genes and their averaged scaled values of log-transformed expression, respectively.
(D) Representative confocal micrographs showing μPASEs generated from wildtype and NODAL-KO hPSCs at t = 48 h, stained for ISL1, GATA3 and TBXT (left) and TFAP2C, NANOG and SOX17 (right).
(E) left: Integrated UMAP plot of wildtype μPASEs at t = 24, 36, 48 h and NODAL-KO μPASEs at t = 48 h, color-coded according to cell identity annotations. right: data from wildtype and NODAL-KO μPASEs are shown in different colors as indicated.
(F) UMAP plots of NODAL-KO (left) and wildtype (right) μPASEs at t = 48 h, with data isolated from E. Doted lines contour cell clusters corresponding to AMLC, PSLC / MeLC and PGCLC lineages.
(G) Percentages of indicted cell types in wildtype (red) and NODAL-KO (blue) μPASEs.
(H) Volcano plots showing DEGs between PSLCs from wildtype and NODAL-KO μPASEs, with selected genes labelled.
(I) Enriched GO categories and KEGG pathways among DEGs between wildtype and NODAL-KO PSLCs.
In D, experiments were repeated three times with similar results. Nuclei were counterstained with DAPI. Scale bars, 50 μm.
