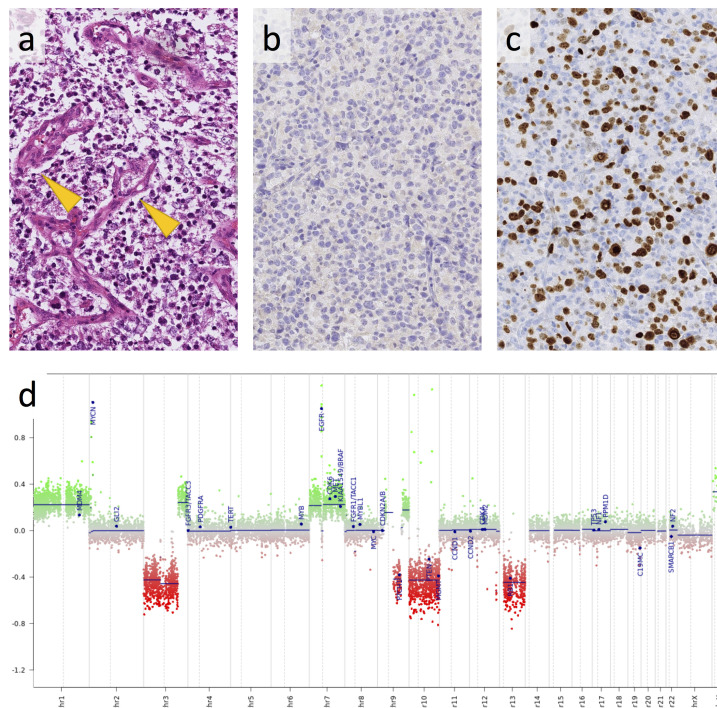
Figure 3.
Histology of the tumour shows a monomorphic population of neoplastic glial glial cells with frequent microvascular proliferations (arrow) (a). Immunoreactivity for mutant IDH1 (R132H) is negative (b) and ki67 immunostain for proliferating tumour cells shows a very high labelling index (c). The copy number profile, derived from the Illumina 450 K methylation array, shows the characteristic chromosome seven gain, 10q loss, and amplification of MYC and EGFR (d). The scale bar corresponds to 200 µm in (a)–(c). EGFR, epidermal growth factor receptor.

