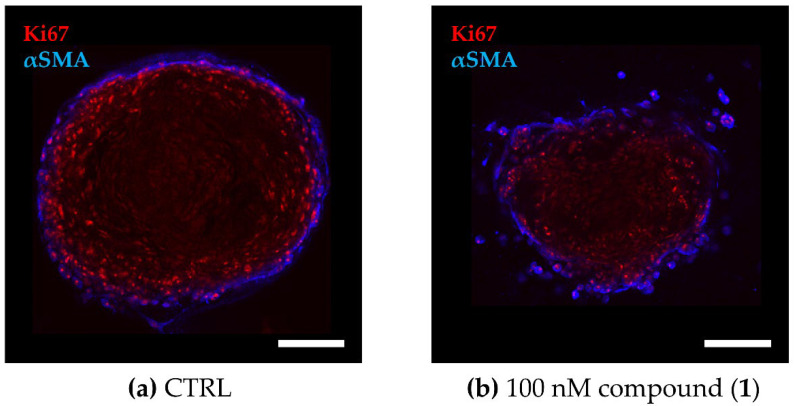
Figure 4.
Cellular distribution within the TNBC co-culture spheroids. The 3D co-culture spheroids composed of primary murine CAFs and MDA-MB-231 cells were grown for 72 h before being treated for another 72 h. (a,b) Fluorescence images of co-culture spheroids that were (a) untreated (CTRL) or (b) treated with 100 nM of compound (1). Optical cross sections of the spheroids were captured after immune staining for Ki67 (red, MDA-MB-231) and αSMA (blue, CAF). Scale bar: 100 µm.

