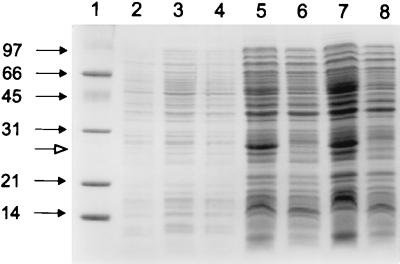
FIG. 2.
SDS-PAGE of overexpressed 4NBen reductase (PnbA) in E. coli (pPROpnbA) on a 15% gel. Lane 1, low-range marker (Bio-Rad); lane 2, uninduced cell extracts of E. coli(pPROpnbA); lane 3, cell extracts of E. coli(pPROpnbA) obtained immediately after induction with IPTG and arabinose (0 h); lanes 5 and 7, cell extracts of E. coli(pPROpnbA) obtained at 4 and 20 h, respectively, after induction; lanes 4, 6, and 8, cell extracts of E. coli(pPROLar.A122) obtained at 0, 4, and 20 h, respectively after induction. Marker sizes are indicated at the left in kilodaltons. The molecular mass of the overexpressed protein (indicated by the open arrow) is ∼25 kDa.

