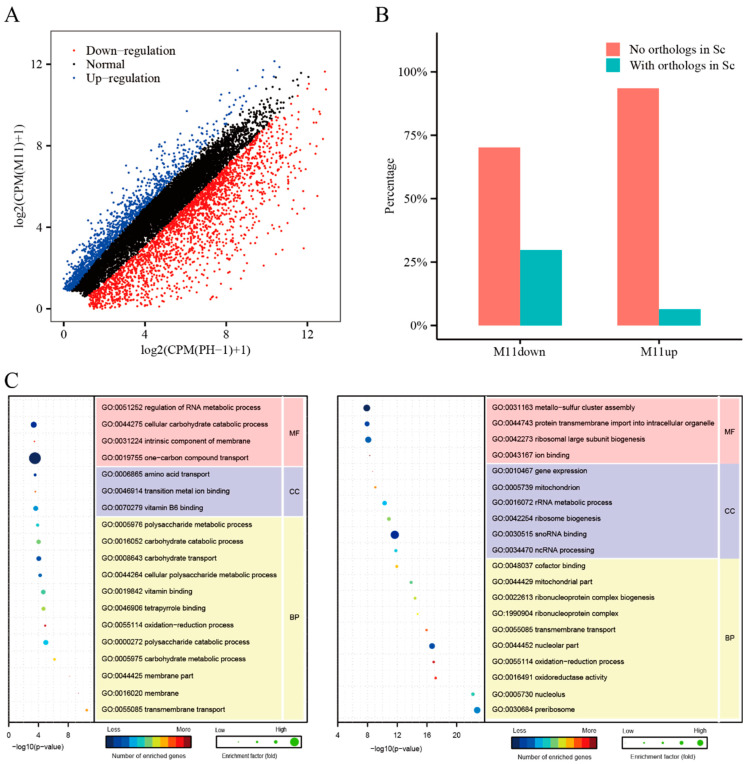
Figure 6.
Assay for the role of FgCsn12 in transcriptional regulation. (A) Genes that were significantly increased (blue dots) and decreased (red dots) over two-fold in the Fgcsn12 mutant in comparison with the wild type. The x-axis and y-axis are the logarithms of CPM (wild-type PH-1) + 1 and CPM (M11) + 1, respectively. (B) The proportion of downregulated genes and upregulated genes with or without orthologs in budding yeast. (C) GO enrichment analysis of the upregulated and downregulated genes in M11. BP, MF, and CC represent biological process, molecular function, and cellular component, respectively.

