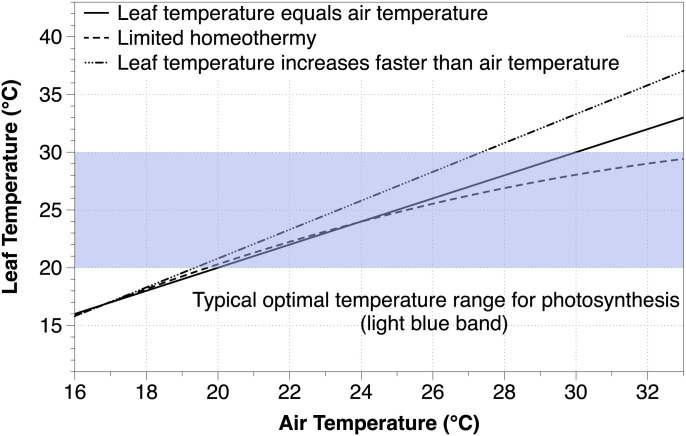
Fig. 1.
Conceptual model of different Tleaf/Tair relationships in relation to optimal temperatures for photosynthesis. The solid line is the 1:1 relationship and represents Tleaf perfectly coupled to Tair, while the dashed-dotted line represents a leaf that warms at 1.25 times the rate of air warming. The dashed line represents an example of limited leaf homeothermy where Tleaf becomes uncoupled from Tair and stays in a narrow optimal temperature range as Tair increases, similar to (18). The light blue area represents a typical optimal temperature range for net leaf photosynthesis from (67).

