Fig. 1.
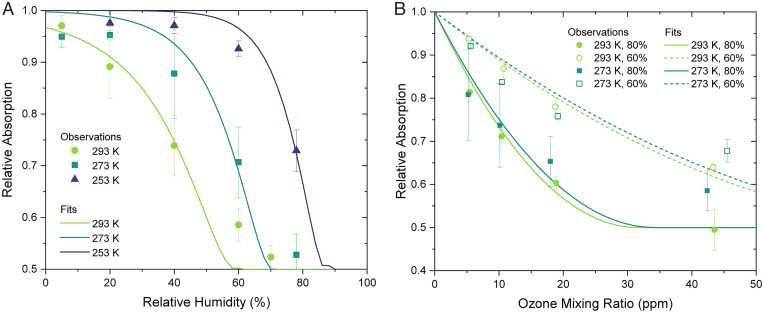
Relative absorption at 405 nm remaining (A) after exposure to 45 ppm of ozone as a function of RH at 253, 273, and 293 K and (B) as a function of ozone mixing ratio at either 273 or 293 K and 60 or 80% RH. The curves represent fits of Eq. 2 to the experimental data points. Error bars represent one SD of four sets of datapoints.

