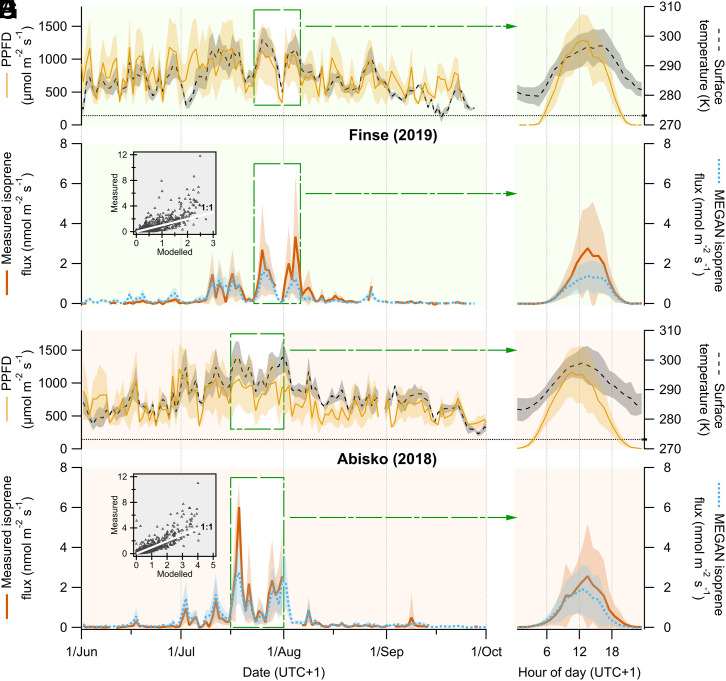
Fig. 1.
PPFD, vegetation surface temperature, and measured and modeled isoprene fluxes for (A–D) Finse and (E–H) Abisko. (Left) The time series of daytime averages between 1 June and 30 September, for which all data points, when PPFD ≥ 300 µmol m−2 s−1 during each day, were averaged (e.g., in the case of measured isoprene, 0 ≤ n ≤ 27 for Finse and 0 ≤ n ≤ 31 for Abisko), resulting in one average data point per day. The green dashed squares behind the traces indicate the time periods of ∼2 wk around the end of July, when isoprene emissions were highest at each site, that were included in the calculation of the diel cycles of hourly averages shown in Right. To calculate the diel cycles of temperature, PPFD, and modeled isoprene, only data points with available concurrent measured isoprene fluxes were used (n = 403 for Finse and n = 575 for Abisko). The trace shading indicates the SDs of daily daytime averages (Left) and hourly averages (Right). The horizontal dotted lines on the temperature axis (A, B, E, and F) indicate the temperature of 0 °C (=273.15 K). Insets in C and G are scatterplots showing the relationship between measured and modeled isoprene fluxes and include a white solid 1:1 identity line as a reference.

