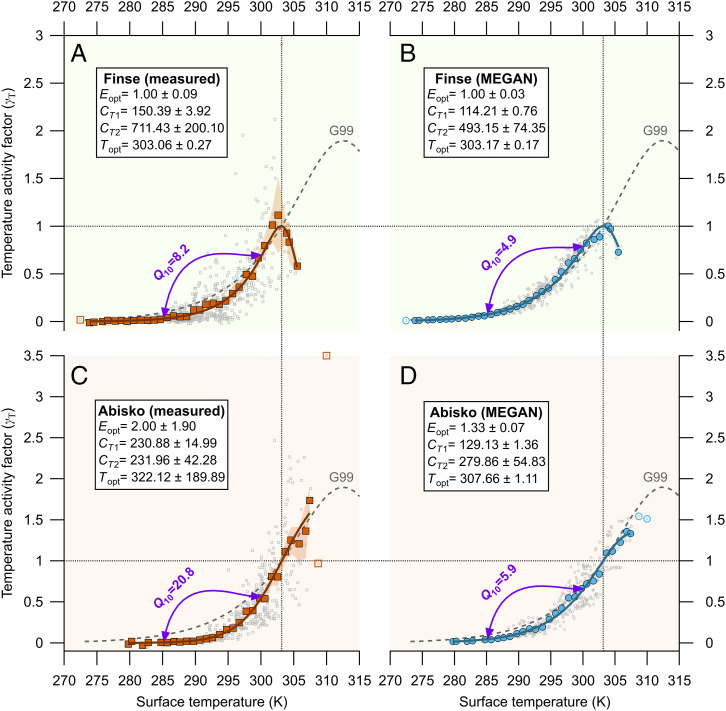
Fig. 2.
(A and C) Measured (square symbols) and (B and D) modeled (circle symbols) isoprene temperature activity factors (γT) plotted against the measured vegetation surface temperature for Finse, Norway (A and B), and Abisko, Sweden (C and D). The temperature emission activity factors here are essentially measured and modeled fluxes normalized to 1 at 30 °C (=303.15 K), as indicated by the dotted horizontal lines at γT = 1 and dotted vertical lines at T = 303.15 K. The small gray open symbols depict the individual temperature activity factors derived from the individual 30-min fluxes (n = 599 for Finse and n = 432 for Abisko) that passed the eddy covariance quality criteria and were not limited by available sunlight (PPFD ≥ 1,000 µmol m−2 s−1). Note that only MEGAN-simulated fluxes that corresponded with an available measured flux, and vice versa, were used in this comparison. The bigger, closed colored symbols represent the averages of the 1 K bins, and their shading represents their SE. These bin averages were fitted to Eq. 1 (Materials and Methods) with an unconstrained orthogonal distance regression weighted by the SE of each bin average. The open colored symbols represent bins that contained a single data value and were excluded from the fit. The text boxes show the fitting results (coefficient ± SD) for the empirical parameters of Eq. 1, and the solid line shows the fit line for each subplot. The purple arrow lines indicate the two temperatures (285.15 and 300.15 K) used to calculate the Q10 values shown above each arrow (Eq. 2). For reference, the gray dashed line in each plot reproduces the standard G99 response curve (Materials and Methods), which between those temperatures has a Q10 of 3.66.

