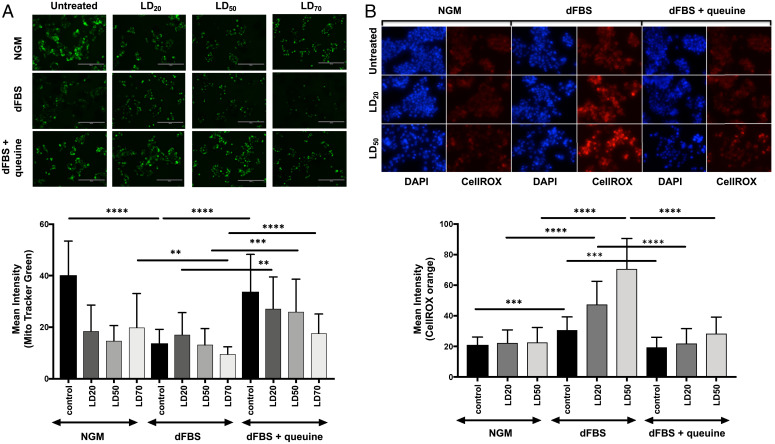
Fig. 3.
Queuine prevents mitochondrial and ROS changes after exposure of HepG2 cells to NaAsO2. (A) MitoTracker Green (green) staining of HepG2 cells grown under different media and NaAsO2 exposure conditions (Top), with quantitation of MitoTracker Green (Bottom). (B) CellRox Orange (orange) and DAPI staining was performed on HepG2 cells grown under different media and NaAsO2 exposure conditions (Top), with quantitation of CellROX Orange (Bottom). Data in all panels represent mean ± SD for three experimental replicates. For (A) and (B): Black bars represent untreated cells, while gray bars shaded represent different NaAsO2 exposure conditions (LD20, LD50, LD70). Data were compared using Student t test, with ****P < 0.0001, ***P < 0.002, and **P < 0.005 in GraphPad Prism 6.0. The concentrations represent the LD20, LD50, and LD70 doses used in NGM.

