Fig. 4.
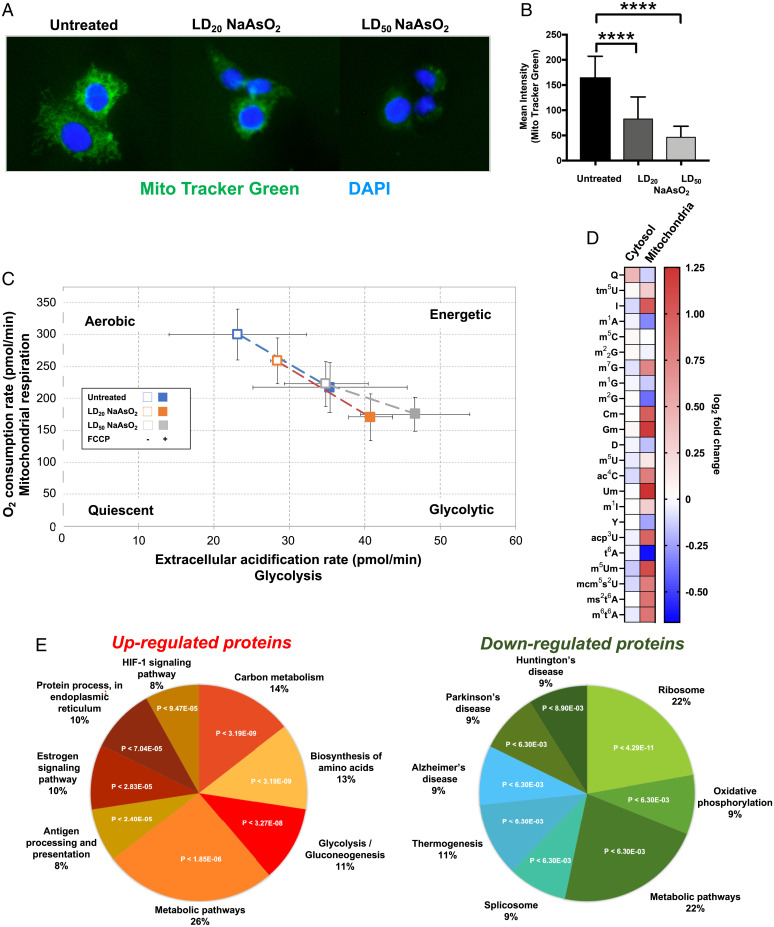
NaAsO2 promotes decreased mitochondrial mass and a shift toward glycolysis. (A) HepG2 cells were exposed to various doses of NaAsO2 and stained with MitoTracker Green (green) and DAPI (blue) 24 h after exposure. (B) The intensity of MitoTracker Green in 22 cells for each condition was determined using ImageJ and plotted as a function of NaAsO2 exposure. In (A) and (B), data were compared using the Student t test, with ****P < 0.0001. (C) After 24 h exposure, Seahorse XFp Cell Energy Phenotype Analysis was performed on HepG2 cells to measure the OCR and ECAR. The open and filled boxes represent the cells in the absence or presence of FCCP for each of the three conditions. Data represent mean ± SD for three experimental replicates. (D) Epitranscriptomic changes in cytosolic and mitochondrial tRNAs of HepG2 cells 2 h after exposure to NaAsO2. (E) Significant (P < 0.05) gene ontology enrichments for proteins that were up-regulated (P < 0.05) or down-regulated (P < 0.05) in HepG2 cells in response to NaAsO2 as determined by proteomics (see SI Appendix, Tables S1 and S2).

