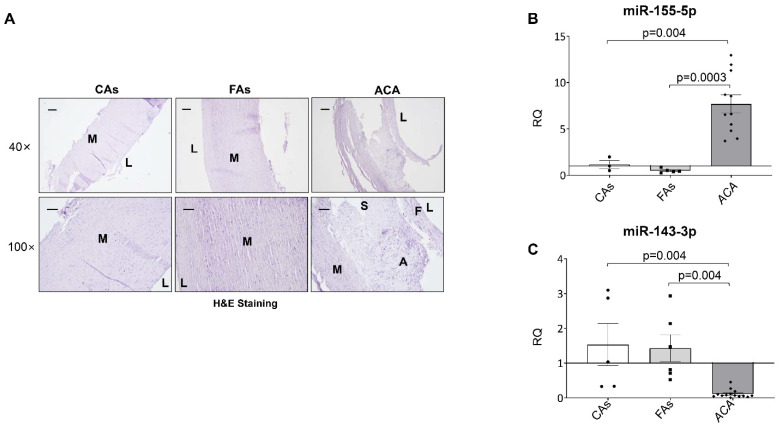
Figure 2.
Characterization of the atherosclerotic plaques and miRNA expression of the human vascular samples. (A) Representative images of the Hematoxylin and Eosin staining from the aorta of control subjects (CAs) and subjects with fibrolipidic lesions (FAs) and the carotid artery from ACA patients (ACA). Magnification 40× (scale bar = 200 µm) and 100× (scale bar = 100 µm). Relative quantification of the levels of the miR-155-5p (B) and miR-143-3p (C) by qPCR. FAs= fibrolipidic plaque; ACA = advanced carotid atherosclerotic plaque; M = media; F = fibrous; S = shoulder; A = atheroma; L = lumen. qPCR miR-155-5p: Control subjects (n = 3); FAs (n = 5); ACA patients (n = 11). qPCR miR-143-3p: Control subjects (n = 5); fibrolipidic patients (n = 6); ACA patients (n = 14).

