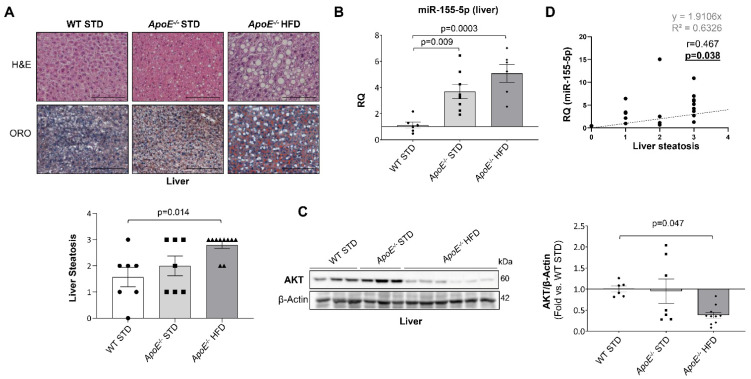
Figure 6.
miR-155-5p is overexpressed and AKT downregulated in the liver of the mouse model after 18 weeks of high-fat diet. miR-155-5p is overexpressed and AKT downregulated in the liver of the mouse model after 18 weeks of high-fat diet. (A) Representative images of H&E staining to perform liver histological analysis (upper) and of Oil Red O staining (lower) to evaluate hepatic-specific lipid content. Magnification 200× (scale bar = 25 µm). Below, its corresponding graph that show the quantification of liver steatosis. (B) Relative expression of miR-155-5p in murine liver samples measured by qPCR. (C) Representative Western blot images of AKT expression (left) and their quantification (right) in liver samples from the mouse groups. (D) Scatter plots and Spearman’s r correlations between liver steatosis and hepatic miR-155-5p expression. WT= Wild type group; STD = standard type diet; ApoE−/− = ApoE deficient mice; HFD = high-fat diet; AKT = protein kinase B. Image and its quantification steatosis liver: WT STD 18 wks (n = 7), ApoE−/− STD 18 wks (n = 7) and ApoE−/− HFD (n = 10) mice after 18 weeks on the diet. miR-155-5p qPCR liver: WT STD 18 wks (n = 6); ApoE−/− STD 18 wks (n = 8); ApoE−/− HFD 18 wks (n = 6). Western blot of AKT liver: WT STD 18 wks (n = 6); ApoE−/− STD 18 wks (n = 7); ApoE−/− HFD 18 wks (n = 10).

