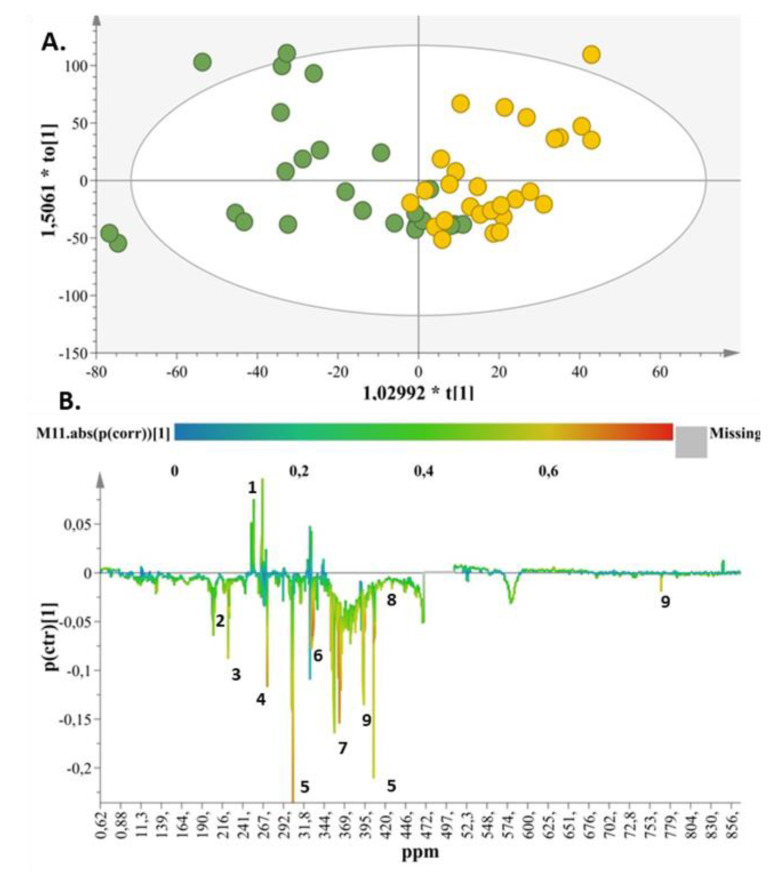
Figure 3.
(A) OPLS-DA score plot for breastfed samples (day 3 (green circles) vs. month 3 (yellow circles)), with A = 1 + 1 + 0, N = 54, R2X(cum) = 0.57, R2Y(cum) = 0.55, and Q2(cum) = 0.41 for pareto scaling and a 95% confidence level of p-value = 0.000139123. (B) S-line plot demonstrating the metabolites responsible for discrimination (1. citric acid, 2. glutamine, 3. acetoacetate, 4. dimethylamine, 5. creatinine, 6. betaine, 7. taurine, 8. threonine, 9. Hippurate).

