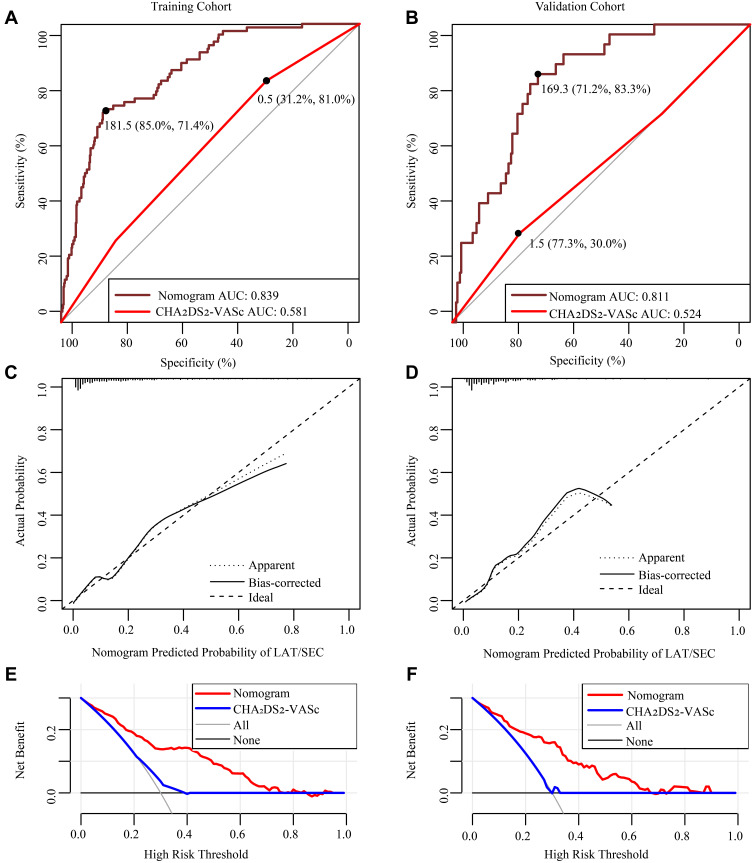
Figure 3.
Model-comparison results of the nomogram and CHA2DS2-VASc score for estimating the risk of LAT/SEC. (A and B) Receiver operating characteristic curve for models in predicting LAT/SEC in the training cohort and validation cohort. (C and D) Calibration curves for the nomogram in the training cohort and validation cohort. The dotted line represents the entire cohort, the solid line is the result after bias correction by bootstrapping (1000 repetitions), indicating nomogram performance (boot mean absolute error=0.019 and 0.028, respectively). (E and F) Decision curve analysis for the nomogram and CHA2DS2-VASc score in the training cohort and validation cohort. The decision curve of the nomogram is composed of an X-axis which represents continuum of potential thresholds for LAT/SEC risk and a Y-axis which represents the net benefit. The horizontal black line: to assume no patients will experience the event; the light gray line: to assume all patients will experience the event. The nomogram had a higher net benefit than CHA2DS2-VASc scores at a threshold probability of 0.1–0.8.
Abbreviation: AUC, area under ROC curve.

