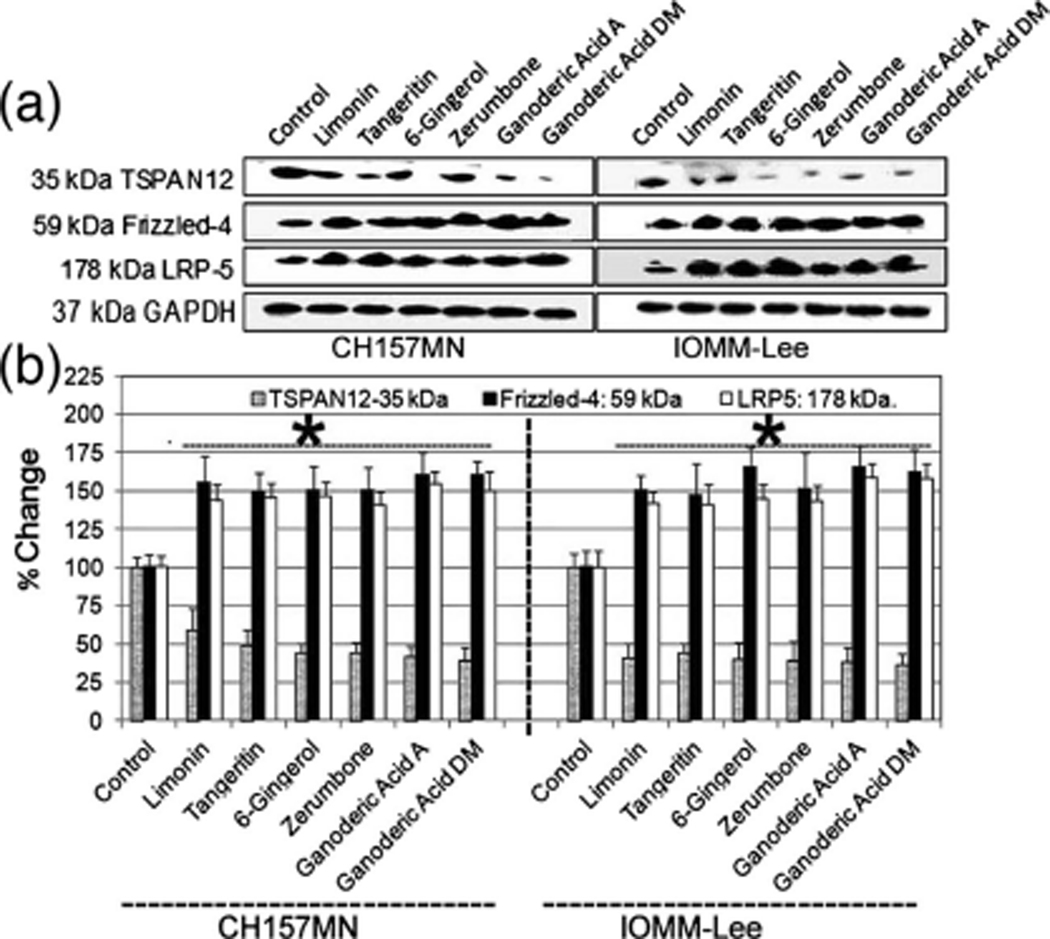
Fig. 3.
Analysis of the expression of TSPAN12, FZD4, and LRP5 at protein levels in IOMM-Lee and CH157MN cells. Treatments (24 h): control, 25 μM Limonin, 25 μM Tangeritin, 25 μM 6-Gingerol, 25 μM Zerumbone, 25 μM Ganoderic Acid A, and 25 μM Ganoderic Acid DM. a Western blots and b quantitative analysis of TSPAN12, FZD4, LRP5, and GAPDH. *P<.05; **P<.01, significant difference between control and drug treatments

