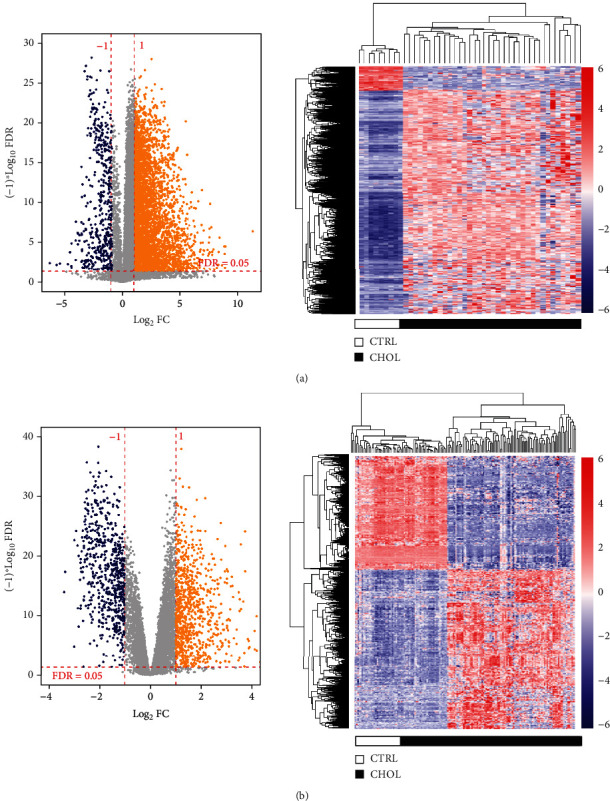
Figure 1.

Volcano plots and clustering analysis of differential expressed RNAs in TCGA (a) and GSE26566 (b) datasets. Blue dots represent the dysregulated genes. Red horizontal line indicates FDR < 0.05, while vertical dotted lines denote |log2FC| > 1.
