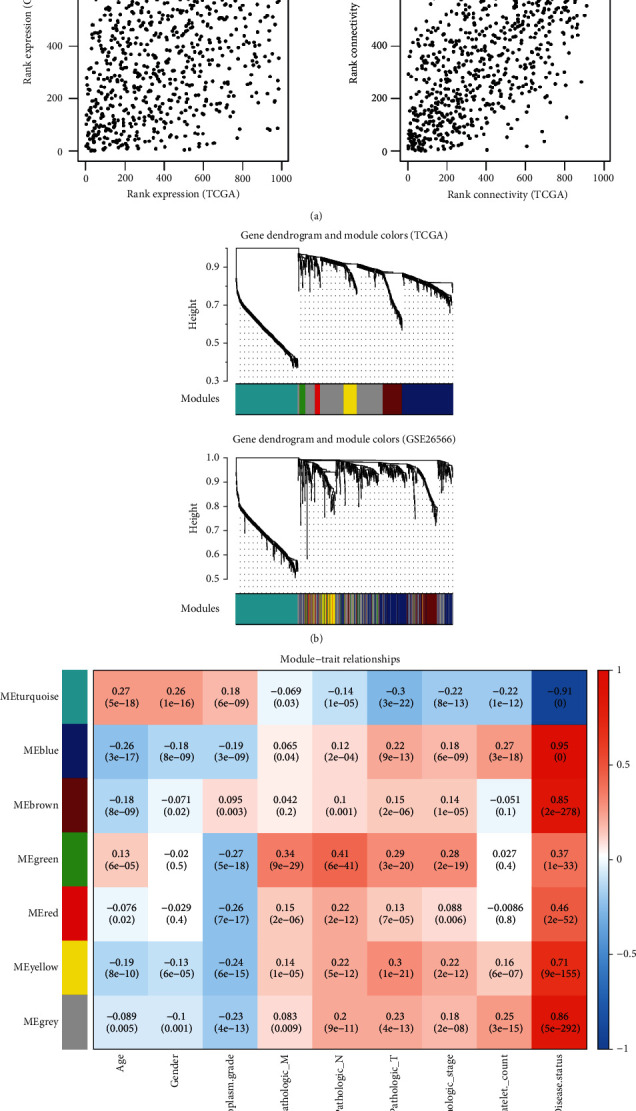
Figure 2.

Weighted gene correlation network analysis to screen gene modules. (a). Gene coexpression analysis and network connectivity analysis. (b). Clustering dendrogram of CHOL-related genes based on TCGA and GSE26566 dataset. (c). Heatmap of modules and clinical trait relationships. The color changes from blue to red represent the changes from negative correlation to positive correlation.
