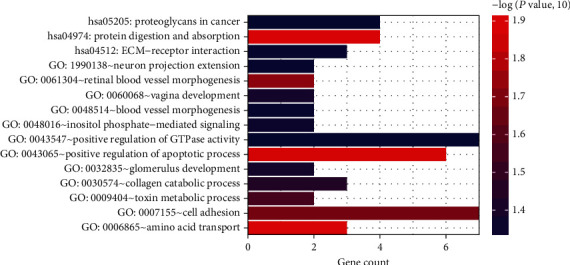
Figure 4.

GO function and KEGG pathway analysis for ceRNA network-based differential expressed RNAs. The horizontal axis refers to gene number, whereas vertical axis means items of biological process or pathways. Increased intensity of red color means more significantly enriched genes.
