Figure 1.

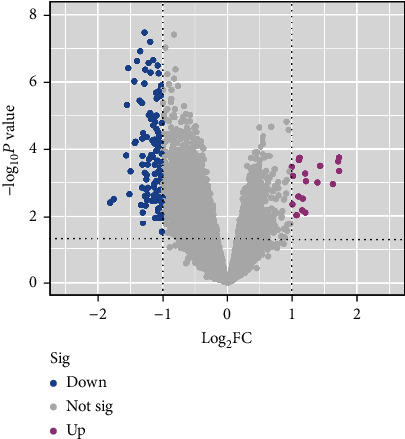
The volcanic map of differentially expressed genes of GSE58331; red dots and green dots represent upregulated and downregulated genes, respectively. P < 0.05, ∣log2FC | ≥1.

The volcanic map of differentially expressed genes of GSE58331; red dots and green dots represent upregulated and downregulated genes, respectively. P < 0.05, ∣log2FC | ≥1.