Figure 1.
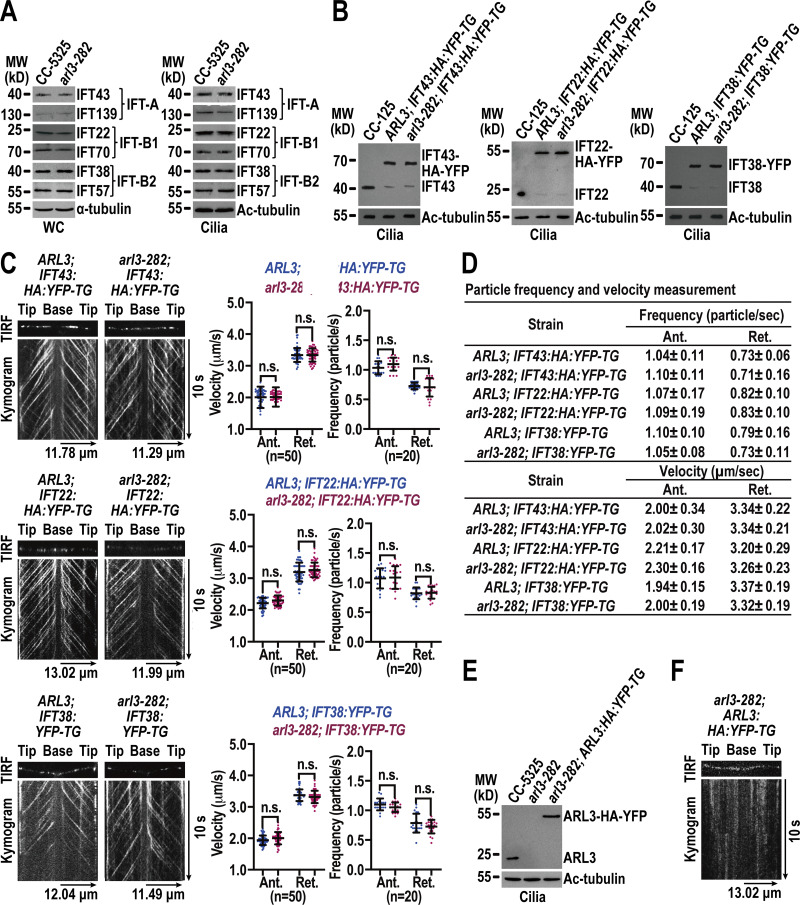
ARL3 enters cilia by diffusion and does not affect IFT. (A) Immunoblots of whole cell (WC) samples and cilia of CC-5325 and arl3-282 cells probed for IFT43 and IFT139 (IFT-A), IFT22 and IFT70 (IFT-B1), and IFT38 and IFT57 (IFT-B2). (B) Immunoblots of cilia of three cell groups indicated on the top probed with α-IFT43, α-IFT22, and α-IFT38, respectively. (C) Representative TIRF images and corresponding kymograms of the three cell groups shown in B. Velocities and frequencies of YFP- and HA-YFP–labeled proteins to traffic inside cilia were shown as graphs. Error bar indicates SD n indicates the number of cilia analyzed. For measuring anterograde and retrograde velocities, 50 cilia were analyzed. 20 cilia were measured for determining anterograde and retrograde frequencies. ns indicates non-significance. One sample unpaired Student’s t test is indicated. (D) Velocities and frequencies of YFP- and HA-YFP–tagged proteins to traffic inside cilia in C shown as numbers. (E) Immunoblots of cilia of CC-5325, arl3-282, and arl3-282; ARL3:HA:YFP-TG cells probed with α-ARL3. (F) Representative TIRF image and corresponding kymogram of the arl3-282; ARL3:HA:YFP-TG cell (Video 1, 15 fps). For A, B, and E, α-tubulin and acetylated (Ac)-tubulin were used to adjust the loading of WC samples and cilia, respectively. MW: molecular weight. For C and D, Ant. and Ret. represent anterograde and retrograde, respectively. For C and F, the time and transport lengths are indicated on the right and on the bottom, respectively. The ciliary base (base) and tip (tip) were shown. Source data are available for this figure: SourceData F1.

