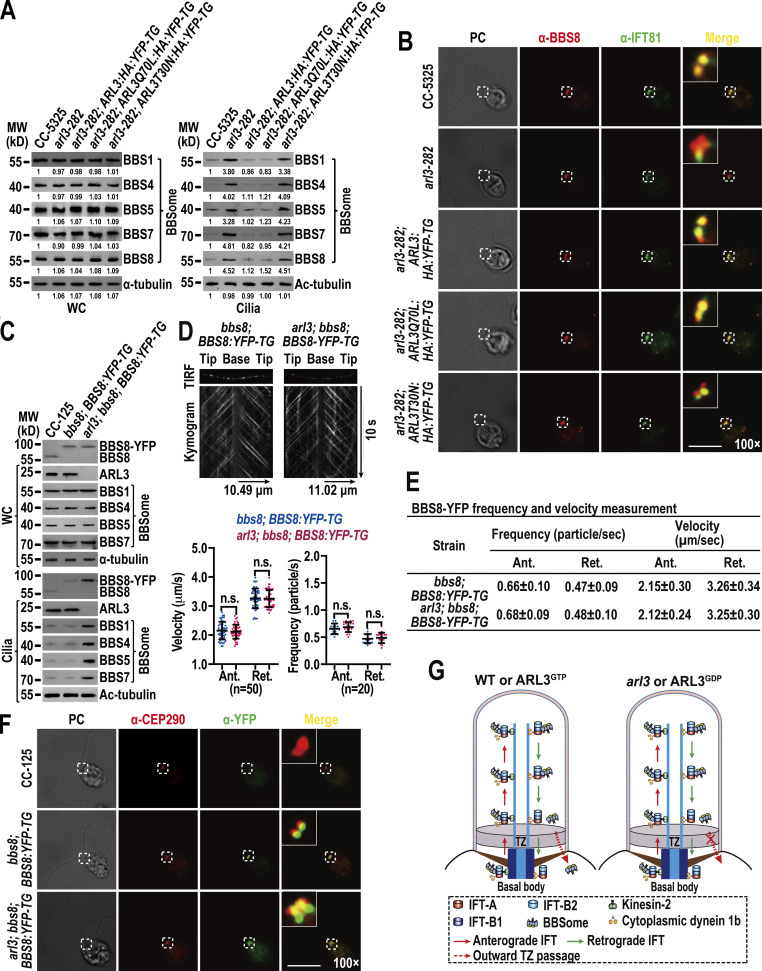
Figure 3.
ARL3GTP promotes the BBSome to move across the TZ for ciliary retrieval. (A) Immunoblots of WC samples and cilia of cells indicated on the top probed for the BBSome subunits BBS1, BBS4, BBS5, BBS7, and BBS8. The numbers below the blots indicate band intensities (CC-5325 as 1). The values were normalized based on the α-tubulin (WC) and Ac-tubulin (cilia) signaling. (B) Cells indicated on the left stained with α-BBS8 (red) and α-IFT81 (green). BBS8 and IFT81 both are basal body markers. (C) Immunoblots of WC samples and cilia of cells indicated on the top probed with α-BBS8, α-ARL3, α-BBS1, α-BBS4, α-BBS5, and α-BBS7. MW, molecular weight. (D) Representative TIRF images and corresponding kymograms of bbs8; BBS8:YFP-TG and arl3; bbs8; BBS8:YFP-TG cells (Videos 5 and 6, 15 fps). The time and transport lengths are indicated on the right and on the bottom, respectively. The ciliary base (base) and tip (tip) were shown. Velocities and frequencies of BBS8-YFP to traffic inside cilia were shown as graphs. Error bar indicates SD; n indicates the number of cilia analyzed. For measuring anterograde and retrograde velocities, 50 cilia were analyzed. 20 cilia were measured for determining anterograde and retrograde frequencies. ns indicates non-significance. One sample unpaired Student’s t test is indicated. (E) Velocities and frequencies of BBS8-YFP to traffic inside cilia of bbs8; BBS8:YFP-TG and arl3; bbs8; BBS8:YFP-TG cells shown as numbers. (F) CC-125, bbs8; BBS8:YFP-TG, and arl3; bbs8; BBS8:YFP-TG cells stained with α-CEP290 (red) and α-YFP (green). CEP290 and BBS8-YFP serve as a TZ and basal body marker, respectively. (G) Schematic representation of how the loss of ARL3 and the presence of ARL3GDP but not ARL3GTP blocks outward movement of the BBSome across the TZ for ciliary retrieval. For A and C, α-tubulin and Ac-tubulin were used to adjust the loading of WC samples and cilia, respectively. For D and E, Ant. and Ret. represent anterograde and retrograde, respectively. For B and F, phase contrast (PC) images of cells were also shown. Inset shows the proximal ciliary region and the basal bodies. Inset magnifications (100 times) were shown. Scale bars, 10 µm. Source data are available for this figure: SourceData F3.

