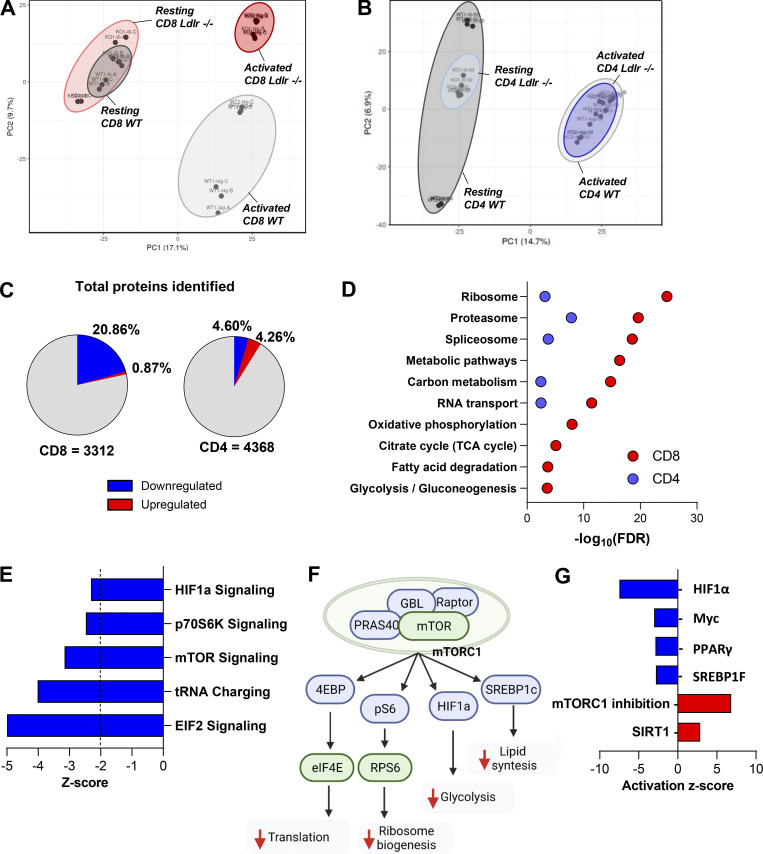
Figure 4.
mTOR pathway in differentially affected in CD8+ T cells from Ldlr−/− mice compared to WT mice. (A and B) Principal component analysis (PCA) of the proteome from CD8+ (A) and CD4+ (B) T cells under resting conditions (A: WT: dark grey ellipse and Ldlr −/−: light red ellipse; B: WT: dark grey ellipse and Ldlr −/−: light blue ellipse), and 96-h after activation (A: WT: light grey ellipse and Ldlr −/−: red ellipse; WT: light grey ellipse and Ldlr −/−: blue ellipse) conditions. (C) Total proteome quantified in activated (96-h) CD8+ and CD4+ T cells of Ldlr −/− mice compared to WT. 29 proteins upregulated and 685 downregulated in Ldlr −/− CD8+ T cells, while 186 were upregulated and 200 were downregulated in Ldlr −/− CD4+ T cells. Red indicates significantly upregulated proteins (Log2FC > 2, P value < 0.05) and blue indicated significantly downregulated proteins (Log2FC < 2, P value<0.05). N = 6/condition, samples derived from two independent experiments and were injected three times each. (D) Gene ontology (GO) enrichment analysis of top significantly modulated pathways (FDR < 0.05) in activated CD8+ (red) and CD4+ (blue) T cells from Ldlr −/− mice compared to WT mice of proteomic dataset. (E) Significant canonical pathways (z-score <−2) generated with IPA associated with mTOR activation cascade from proteomic dataset in activated CD8+ T cells from Ldlr −/− mice compared to WT mice. (F) Graphical representation of key mTORC1 downstream signaling proteins which are predicted to be either downregulated (green) or inhibited (blue) by IPA analysis in activated CD8+ T cells from Ldlr −/− mice compared to WT mice. Prediction of mTORC1 inhibition leads to reduced translation, ribosome biogenesis, energetic (glycolysis), and lipid (cholesterol and fatty acid synthesis) metabolism. Created by Biorender.com. (G) Representation of upstream analysis generated with IPA for significant up- or downregulated transcriptional regulators (Z-score >2 and −log(P Value) >1.34) in the proteomic dataset of 96-h activated CD8+ T cells from WT and Ldlr −/− mice. Prediction of mTORC1 inhibition was identified as “sirolimus treatment.”

