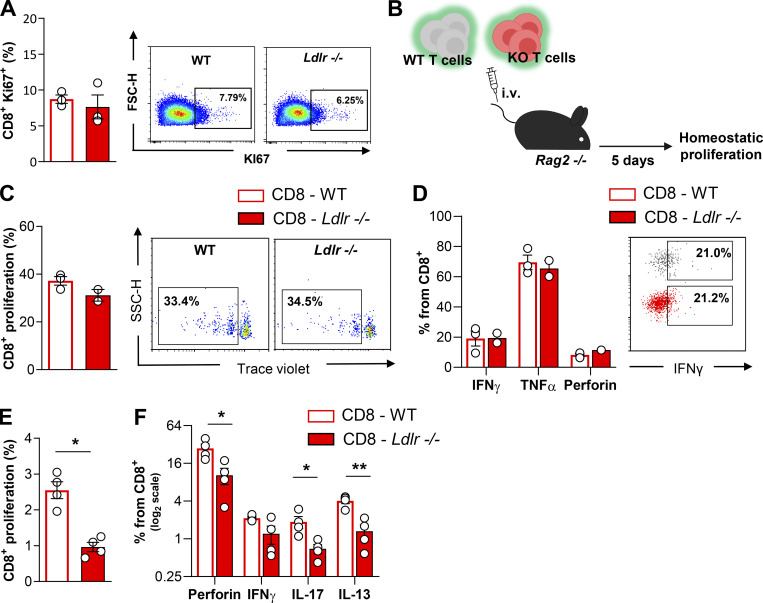
Figure S2.
Proliferation after in vivo homeostatic and in vitro antigentic stimulation of CD8+ T cells from WT and Ldlr −/− mice. (A) Percentage of Ki67+ CD8+ T cells in lymph nodes of WT and Ldlr −/− littermates under resting conditions, n = 3/group. Representative density plots from flow cytometry analysis are shown on the right. (B) Workflow of homeostatic proliferation experiment: T cells isolated from WT and Ldlr −/− mice were labelled with an intracellular dye and intravenous (i.v.) injected into Rag2 −/− mice. 5 d after, labeled cells were detected from spleens. (C and D) Homeostatic proliferation (C) and cytokine production (D) of CD8+ T cells from WT and Ldlr −/− mice i.v. injected into Rag2 −/− mice after 5 d; representative histograms from flow cytometry analysis are shown. (E and F) Proliferation (E) and cytokine production (F) of CD8+ T cells from spleens of WT and Ldlr −/− mice immunized with ovalbumin and restimulated ex vivo with OT-I peptides for 5 d, n = 4/group; representative histograms from flow cytometry analysis are shown. Results are presented as mean per group ± SEM; statistical analysis is performed with Mann-Whitney test; *P < 0.05 and **P < 0.01 (A, C, and D–F).

