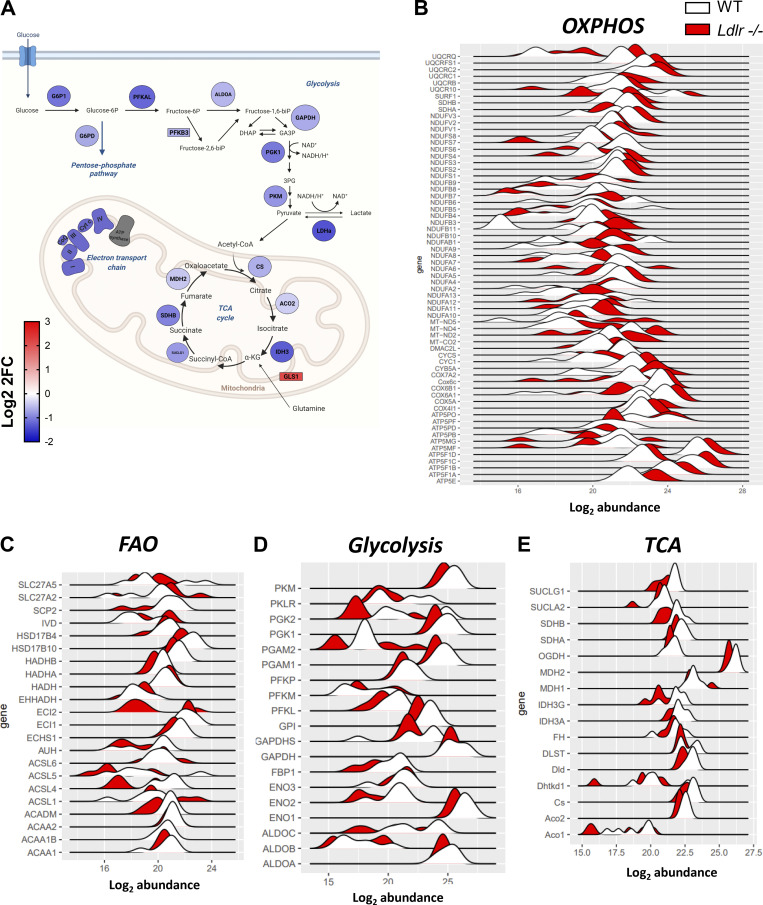
Figure S6.
Analysis of cellular metabolism of CD8+ T cells from WT and Ldlr −/− mice from proteomic dataset. (A) Functional representation of activated CD8+ T cells protein signature from of Ldlr −/− mice compared to WT mice. Blue denotes downregulation, while red upregulation of Log2FC (fold change) from proteins (circles) and genes (rectangles). Created by Biorender.com. (B–E) Abundance distribution of differentially expressed proteins in oxidative phosphorylation (OXPHOS, B), fatty acid oxidation (FAO, C), glycolysis (D) and Kreb’s cycle (TCA, E) among activated CD8+ T cell subset from Ldlr−/− compared to WT mice. Data are from two independent experiments, each with three technical triplicates.

