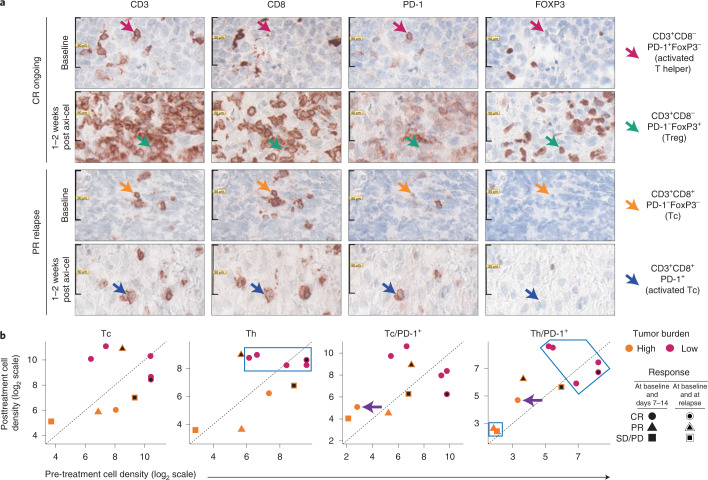
Fig. 2. Evolution of T cell subset densities in the TME after axi-cel infusion.
a, Representative T cell subset densities measured by Immunoscore TCE/TCE+ in patients with ongoing CR versus PR with relapse before and after axi-cel infusion (FFPE biopsy specimens, one staining per sample per marker). b, Evolution of T cell subset densities in the TME as a function of clinical response and TB. Analysis by Immunoscore TCE/TCE+ of FFPE biopsy specimens from ten patients in ZUMA-1 with high (>3,000 mm2; n = 5) or low (<3,000 mm2; n = 5) TB. Seven of the paired samples belonged to subsets 1 and 2, and three belonged to subsets 1 and 3. Six patients had CR; two patients had PR; and two patients had SD/PD. In the Th panel, the blue square indicates five patients with CR with low TB and high Th cell density within the TME pre-infusion and post-infusion (50% of tested patients, two-sided exact Fisher test, P = 0.10). One patient relapsed >6 months after initial CR (circle with black center). The purple arrows in the Tc/PD-1+ and Th/PD-1+ panels indicate a patient with CR despite high TB and with increased PD-1+ tumor-infiltrating T cells in post-treatment TME (10% of tested patients). The black square in the Th/PD-1+ panel indicates non-CR patients with high TB and low CD4+ T cell density pre-treatment and post-treatment (20% of tested patients, Fisher test, P = 0.09). Data are also shown for two patients (one with PR and one with SD/PD) with high TB and intermediary/high tumor-infiltrating T cell density post-infusion who both relapsed (20% of tested patients, Fisher test, P = 0.10). FOXP3, forkhead box P3; PD, progressive disease; PD-1, programmed cell death protein 1; PR, partial response; SD, stable disease.

