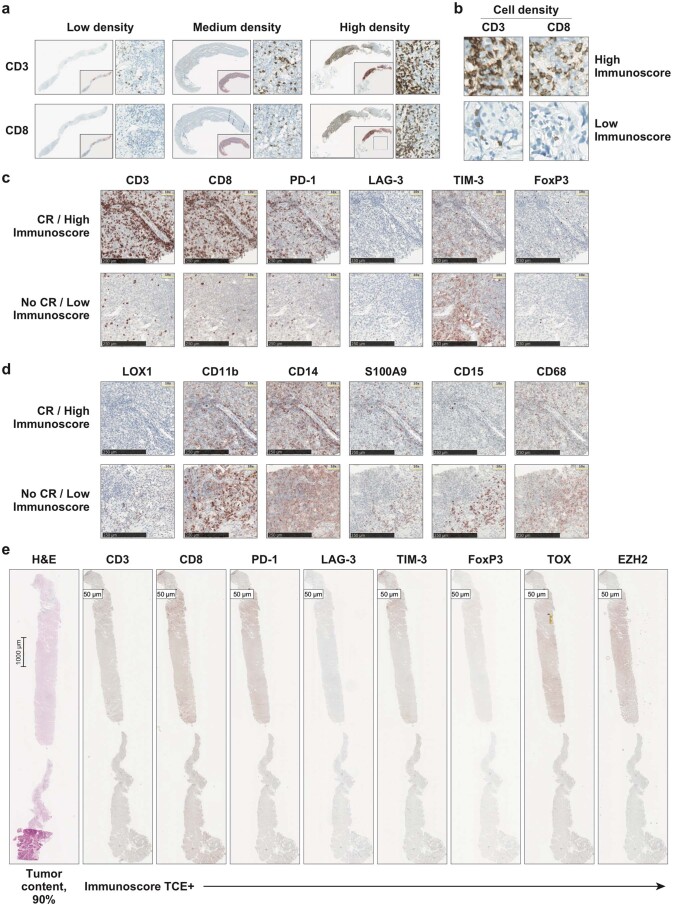
Extended Data Fig. 3. Overview of Immunoscore index, Immunoscore TCE/TCE+ panels, and Immunoscore SC panel.
a,b, Following the pathologist selection of a digital image area, IHC staining of CD3 and CD8 was quantified by the application of a prespecified bioinformatics algorithm that generated analysis cutoffs and a numerical index named Immunoscore. Because the majority of lymph node biopsy specimens lacked an identifiable invasive margin, as expected for lymphoma, cell densities were calculated from the core tumour only. a, Representative images (250- and 1000-µm scales) of CD3 and CD8 T-cell densities (low, medium, or high) in tumour biopsy specimens. b, Representative images (50- µm scale) of CD3 and CD8 T-cell densities in patients with a high (top panels) or low (bottom panels) Immunoscore index. c,d, Representative images (250-µm scale) of successive stainings with Immunoscore TCE (c) and Immunoscore SC (d) panels of tumour biopsy specimens from patients in ZUMA-1 with CR (top panels) or without CR (bottom panels). e, Representative images (50-µm scale) of stainings with Immunoscore TCE+ panel of tumour biopsy specimens. One staining per sample per marker. EZH2, enhancer of zeste homolog 2; FOXP3, forkhead box P3; H&E, haematoxylin and eosin; IHC, immunohistochemistry; LAG-3, lymphocyte-activation gene 3; LOX-1, lectin-type oxidised LDL receptor 1; PD-1, programmed cell death protein 1; SC, Suppressive Cell; TCE, T-cell Exhaustion; TIM-3, T-cell immunoglobulin and mucin domain 3; TOX, thymocyte selection–associated high mobility group box.

