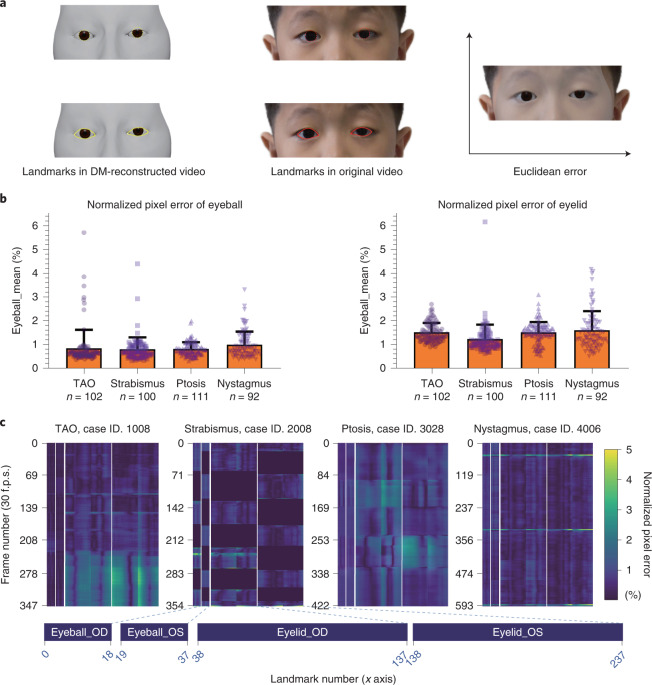
Fig. 2. Quantitative evaluation of the digital mask.
a, Schematic indicating how the Euclidean error was calculated. For both eyeball and eyelid reconstruction, we project the 3D points to 2D image space (yellow) and calculate the Euclidean pixel distance between them and landmarks in the original video (red). The Euclidean error was normalized by the pixel distance between the center of two eyes to exclude the influence of face size. b, The normalized pixel error of different ocular diseases for eyeball (left) and eyelid (right) reconstruction. Results were expressed as mean ± s.d. c, Heat map of the normalized pixel error for four cases. The frame number of each video (30 f.p.s.) is plotted on the y axis. Landmark numbers (238 in total, 38 landmarks for eyeballs and 200 landmarks for eyelids) are plotted in order on the x axis. Normalized pixel error (0–5%) is indicated by the collar bar at the right. The closer the color is to blue, the more accurate the performance is. OD, right eye; OS, left eye; f.p.s., frames per second.

