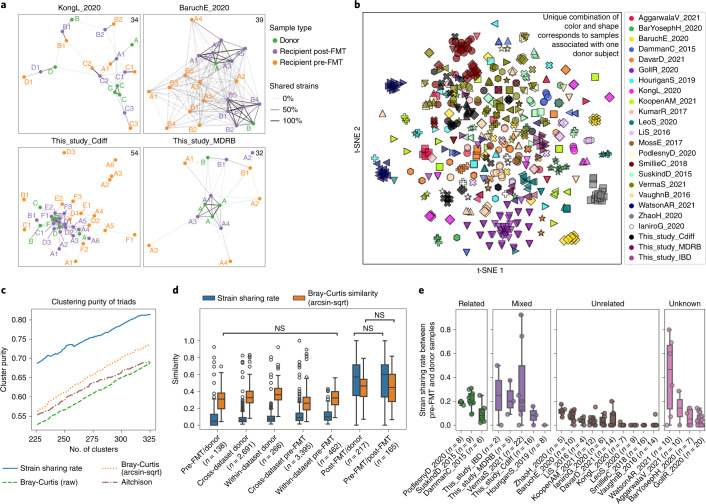
Fig. 1. Overview of microbial strain sharing in FMT studies.
a, Strain-sharing networks of the two new FMT cohorts with C. difficile and MDRB colonization and of two published FMT cohorts9,30. Nodes represent samples and are colored by role in FMT triads. The letters correspond to the donor subject and letter/number combinations indicate both associated donors (the letter) and FMT instance membership (the number) of pre-/post-FMT samples. Edges report strain sharing (minimum 2) and their opacity is scaled to the maximum number of shared strains in each dataset (indicated in the top right corner). Extended Data Fig. 1 reports the networks of all 24 datasets. b, Ordination of samples from all cohorts based on strain sharing rates (t-SNE with perplexity = 20). See Extended Data Fig. 3 for a PCoA ordination. c, Strain-sharing enabled more precise reconstructions of the true FMT triads compared with species-level β-diversities (Extended Data Fig. 2 and Supplementary Table 5). We compare the K-medoids clustering purity of FMT triads between strain-sharing distances and on Bray–Curtis dissimilarities/Aitchison distances as a function of the number of clusters K. d, Strain-sharing rate and Bray–Curtis similarity between pairs of samples show that strain-sharing rates increase much more after FMT compared with Bray–Curtis similarity. Significance was assessed by Mann–Whitney U-tests and the two-tailed P values were FDR-adjusted using the BH method. All pairwise tests are significant except for those labeled NS. All P and Q values are reported in Supplementary Table 6. e, Distribution of strain-sharing rates between donor and corresponding recipient pre-FMT samples showing that donors share more strains with recipients pre-FMT when the individuals are ‘related’ (same family/household or friends; Methods). Boxplots report the median and upper/lower quartiles, whiskers are at 1.5 times higher/lower of the upper/lower quartiles.

