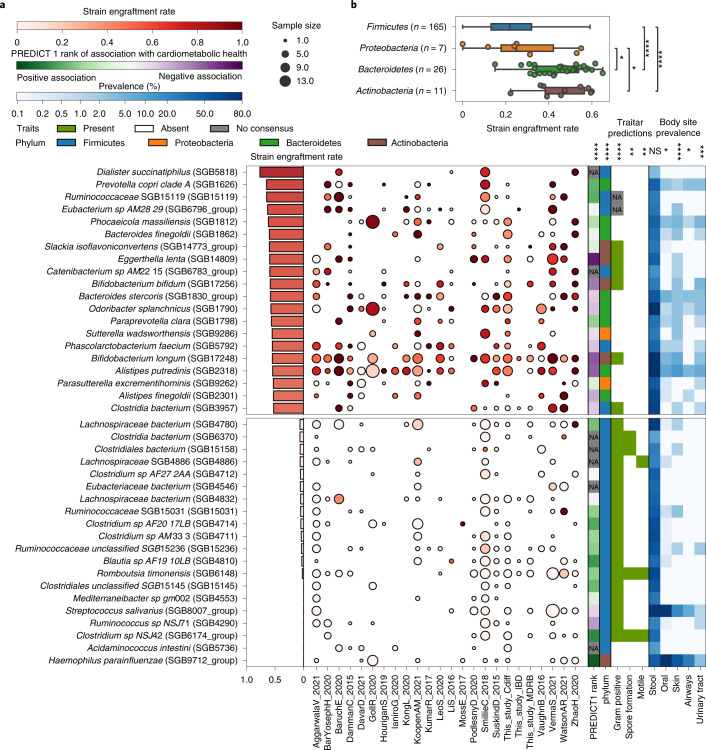
Fig. 3. Bacterial strain engraftment rates across datasets and their associations with phenotypic properties, cardiometabolic health and prevalence.
a, Overall and within-dataset strain engraftment rates and associations of species with predicted phenotypic properties62, cardiometabolic health53 and prevalence (%) in different human body sites. Overall strain engraftment rate is computed over all triads. Out of 211 species assessed (Supplementary Table 8), the 20 species displaying highest and lowest engraftment rates are reported. Associations with continuous variables were tested with Spearman’s rank correlation tests, while those with binary categorical variables were tested with the Mann–Whitney U-test. The association with phylum was tested with the Kruskal–Wallis test. Tests were performed for all species including those not shown, and P values were FDR corrected using the BH method (Supplementary Table 10). Significance levels (NS, nonsignificant, *Q < 0.05, **Q < 0.01, ***Q < 0.001, ****Q < 1 × 10⁻⁴) are reported above each metadata column. Sample size is defined as the number of FMT triads in which the species could engraft as defined by the strain engraftment rate measure (Methods). b, Strain engraftment rates are significantly associated with bacterial phyla (Kruskal–Wallis test, P = 3 × 10–11; post hoc Dunn tests FDR corrected using the BH method, Firmicutes versus Bacteroides Q = 8.0 × 10⁻⁹, Firmicutes versus Actinobacteria Q = 3 × 10⁻⁵, Proteobacteria versus Bacteroidetes Q = 0.037, Proteobacteria versus Actinobacteria Q = 0.037, the remaining pairs are NS, that is Q > 0.1). The Euryarchaeota and Verrucomicrobia phyla were omitted from the analysis as only one species in each of those phyla was assessed in our analysis. Boxplots report the median and upper/lower quartiles, whiskers are at 1.5 times higher/lower of the upper/lower quartiles. NA, not applicable.

