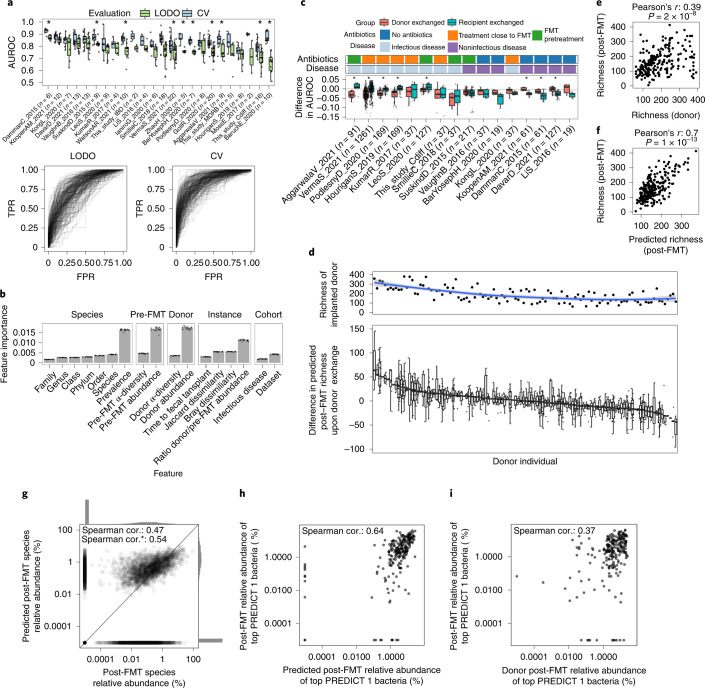
Fig. 4. RF models predict post-FMT microbiome composition and the effect of different donors on the post-FMT microbiome.
a, RF predictions of the presence or absence of species post-FMT. LODO and CV AUROC are reported and represented as true positive rates (TPR) versus false positive rates (FPR). b, The relative importance of microbial features in the LODO model (n = 24 for each bar). Data are presented as mean, error bars correspond to s.d. c, Distribution of the changes in AUROC values for the LODO models of a upon donor exchange (Methods). d, Top panel, species richness of FMT donors. The blue line is a locally estimated scatterplot smoothing fit, the shaded area corresponds to the 95% confidence interval. Bottom panel, difference in post-FMT species richness upon donor exchange with respect to the predicted post-FMT species richness of the real triad n(total) = 1,317. e, Donor species richness is positively correlated with recipient’s post-FMT species richness (Pearson’s correlation test, r = 0.39, P = 2 × 10⁻⁸). f, Predicted post-FMT species richness is strongly correlated with the actual post-FMT richness (Pearson’s correlation test, r = 0.7, P = 1 × 10–13). g, An RF regression model is able to predict bacterial abundances in the post-FMT microbiome. The asterisk designates the Spearman correlation (cor.) when omitting truly absent species predicted to be absent. Individual datasets are reported in Supplementary Fig. 10. h, The cumulative abundance of the top 20% PREDICT 1 bacteria post-FMT can be predicted fairly accurately using the RF regression model. i, Donor abundance is a worse predictor of the cumulative abundance of the top 20% PREDICT 1 bacteria than the RF regression model. Boxplots report the median and upper/lower quartiles, whiskers are at 1.5 times higher/lower of the upper/lower quartiles.

