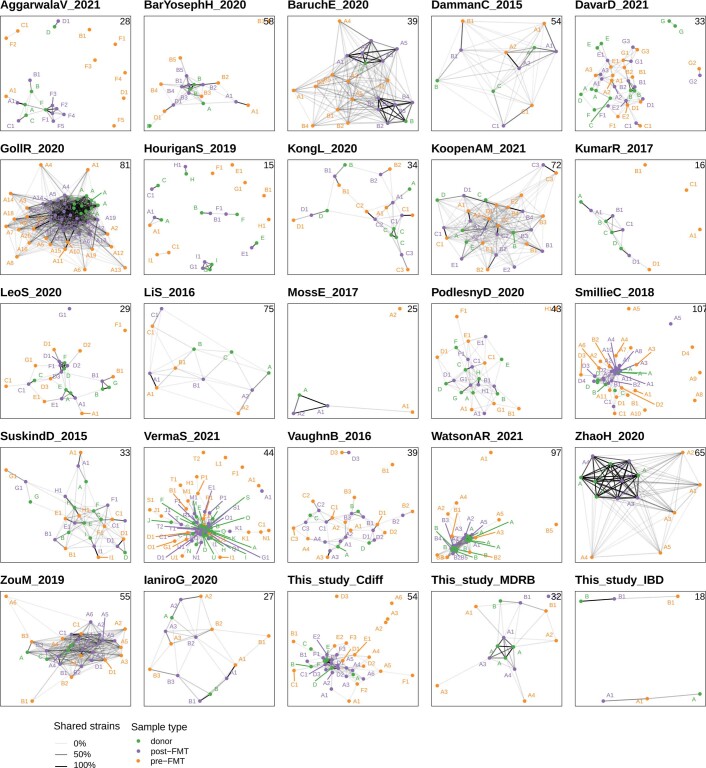
Extended Data Fig. 1. Strain sharing networks for the datasets included in this study not shown in Fig. 1A.
Each node corresponds to a sample and is colored by its role in FMT triads (recipient pre-FMT sample, recipient post-FMT sample, and donor's sample). Edge opacity is proportional to the number of shared strains between two samples (Methods) and only edges corresponding to at least 2 shared strains are shown. The structure of the networks illustrates how FMT triads tend to cluster together but with different clustering characteristics across cohorts.

