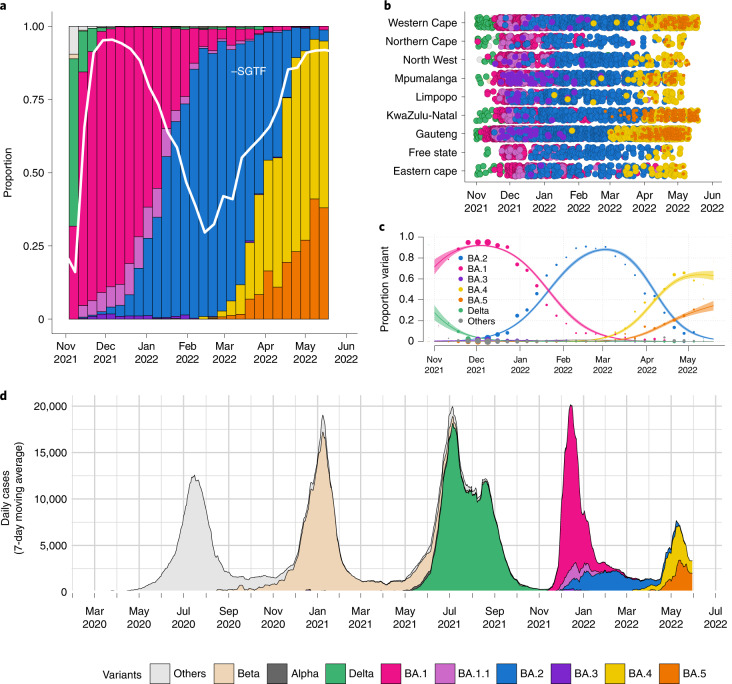
Fig. 2. Distribution of SARS-CoV-2 lineages in South Africa.
a, Changes in the genomic prevalence of Omicron lineages in South Africa from November 2021 (when BA.1 dominated) to May 2022 (when BA.4 and BA.5 were increasing in frequency), superimposed with the proportion of positive TaqPath qPCR tests exhibiting SGTF from November 2021 to May 2022. Estimations of genomic prevalence and SGTF proportions are done from different samples and datasets and presented together here only for illustrative purposes. b, The count of Omicron lineage genomes per province of South Africa over November 2021 to May 2022. BA.4 and BA.5 have been detected in all nine provinces. c, Modeled linear proportions of the Omicron lineages in South Africa. BA.1 rapidly outcompeted Delta in November 2021 and was then superseded by BA.2 in early 2022. BA.4 and BA.5 appear to be swiftly replacing BA.2 in South Africa. Model fits are based on a multinomial logistic regression, and dot size represents the weekly sample size. The shaded areas correspond to the 95% CIs of the model estimates. d, The progression of the 7-day rolling average of daily reported case numbers in South Africa over 2 years of the epidemic (April 2020 to May 2022). Daily cases are colored by the inferred proportion of SARS-CoV-2 variants prevalent at a particular period in the epidemic.

