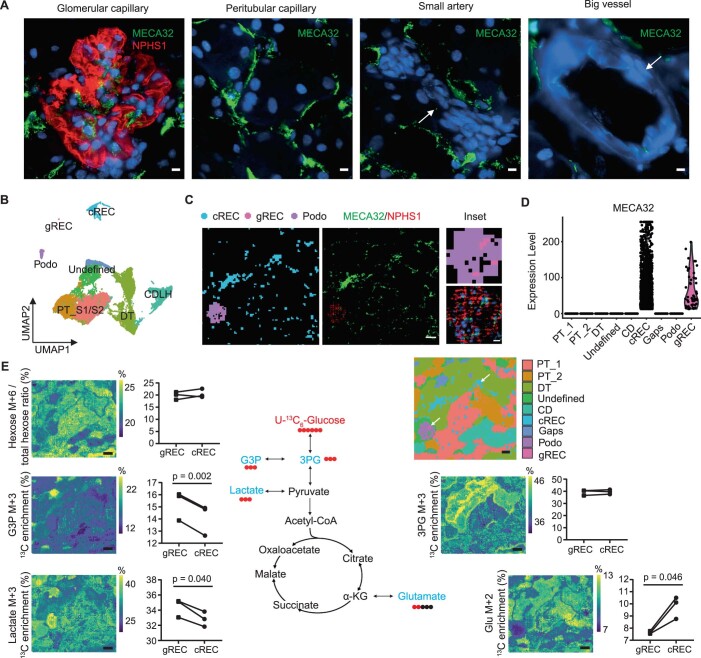
Extended Data Fig. 7. Dynamic metabolic measurements on kidney endothelial cells.
a, MECA32 staining of different vessels in mouse kidney to show specific capillary endothelial cell staining (Scale bar = 5 µm). Arrows depict the vessels with negative MECA32 staining. b, Metabolic heterogeneity within cortical cells in kidney, visualized in a two-dimensional UMAP plot of combined MALDI-MSI data and immunofluorescence staining at 5 × 5 µm2 pixel-size. Glomerular endothelial cells (gREC) and peritubular endothelial cells (cREC) were identified using the post-MALDI-MSI anti-MECA32 antibody staining and podocytes (Podo) with anti-NPHS1 antibody staining. Proximal tubules (PT), distal tubules (DT) and collecting ducts (CD) were identified based on their respective lipid profiles obtained from measurement shown in Extended Data Fig. 1b. c, Immunofluorescent (MECA32 and NPHS1, middle panel; scale bar = 40 µm) staining on post-MALDI-MSI tissue to determine gREC, cREC and podocyte distribution (left panel). Pixel colors used are similar to the given UMAP cell-cluster colors in A. Inset view of detailed glomerular area (right panels, scale bar = 5 µm). d, MECA32 expression in the observed cell types. e, Dynamic metabolic measurements using U-13C6-glucose. Graphs show the 13C enrichment of isotopologues of glucose, glycerol 3-phosphate (G3P), 3-phosphoglycerate (3PG), lactate and glutamate over time in gREC and cREC. Two tailed paired t-test was performed (n = 3). Spatial UMAP shows the metabolic cellular architecture of the tissue (arrows depict cREC and gREC). Pixel colors used are similar to the given UMAP cell-cluster colors in B. Scale bar = 200 µm.

