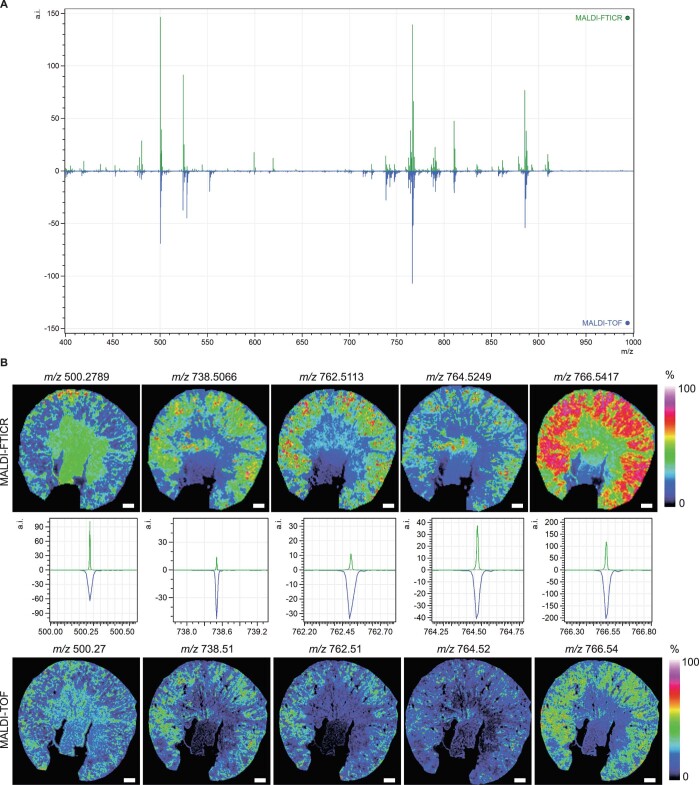
Extended Data Fig. 9. Validation of MALDI-FTICR and MALDI-TOF data.
a, Comparison of the average mass spectrum of an area with 50 × 50 µm2 pixel-size (top, green) acquired by MALDI-FTICR and the average spectrum of 20 × 20 µm2 pixel-size (bottom, blue) acquired by MALDI-TOF. b, Comparison of the lipids distribution recorded by MALDI-FTICR at 50 × 50 µm2 pixel-size and MALDI-TOF at 20 × 20 µm2 pixel-size on same kidney. Scale bar = 500 µm.

