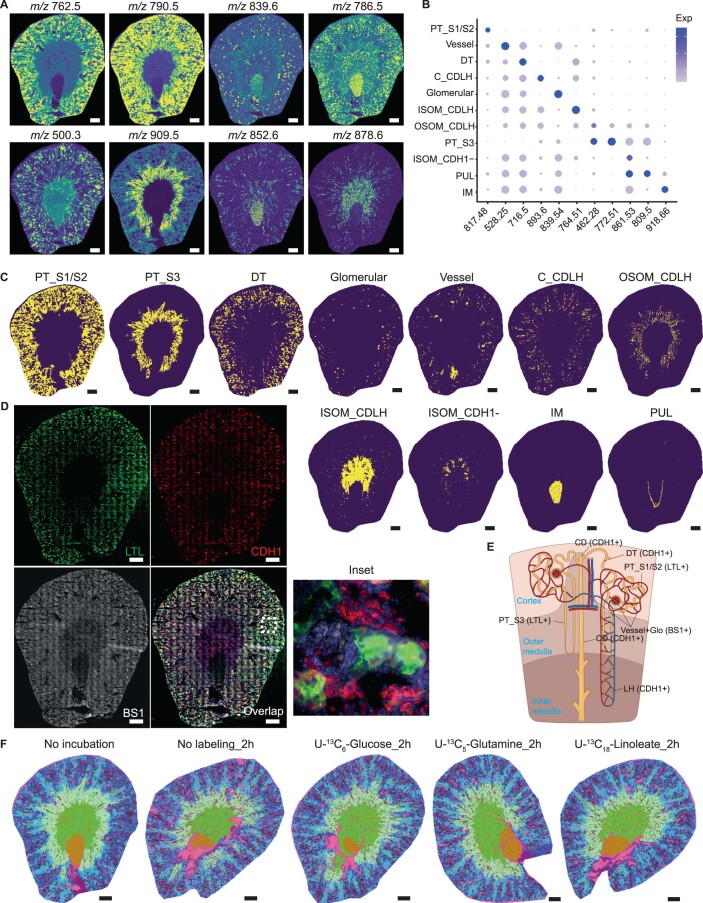
Extended Data Fig. 1. Lipid heterogeneity and stability in mouse kidneys.
a, Lipid species distribution in a mouse kidney tissue sample as recorded by MALDI-MSI at 20 × 20 μm2 pixel-size. b, Dot plot displaying lipid expression of cluster-enriched signatures. c, Distribution of different renal cell clusters on tissue as identified in Fig. 2a. d, Immunofluorescent staining (Lotus Tetragonolobus Lectin (LTL, green), E-cadherin (CDH1, red) and BS1-lectin (gray)) after MALDI-MSI measurement. e, Nephron anatomy showing the identification of renal cell types based on immunofluorescent staining. f, Molecular histology of kidneys generated from integrated three-dimensional UMAP analysis of different datasets based on lipid profiles showing the specificity and stability of lipids profiles after introducing 13C-labeled nutrients for 2 hours. All scale bars = 500 µm. Abbreviations: PT_S1/S2, cortical proximal tubular segments 1/2; PT_S3, outer stripe of outer medulla proximal tubular segment; DT, distal tubule; CDLH, collecting duct and loop of Henle; IM, inner medulla; ISOM, inner stripe of outer medulla; OSOM, outer stripe of outer medulla; PUL, pelvic urothelial lining.

