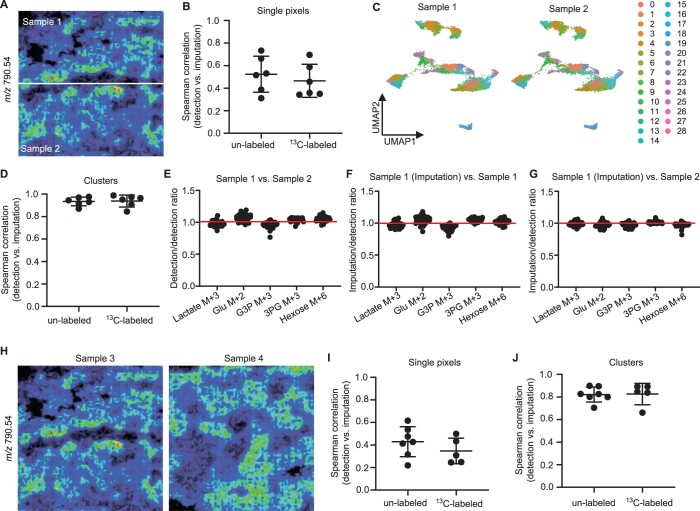
Extended Data Fig. 3. Validation of the imputation performance – ‘leave-one factor-out’ cross-validation.
a, MALDI-MSI data from a single kidney measurement, which was incubated with U-13C6-glucose for 2 h, was bisected (into sample 1 and sample 2) and used to test the accuracy of the imputation. m/z features corresponding to metabolites were taken out from sample 1. Based on these lipid profiles, metabolite abundance of sample 2 was used to impute their abundance in sample 1. b, Spearman’s correlation analysis on the imputed and detected metabolites in kidney sample 1 based on all the pixels. Dots represent different metabolites. c, UMAP analysis on integrated MALDI-MSI data of the 2 samples and resulting 29 clusters. d, Spearman’s correlation analysis on the average value of each cluster between the imputed and detected metabolites abundance in kidney sample 1. e, The ratio of the 13C enrichment calculated from detected metabolites abundance in the 29 clusters between sample 1 and sample 2. Dots represent different clusters. f, The ratio of the 13C enrichment calculated from the imputed and detected metabolites abundance in the 29 cell clusters of kidney sample 1. Dots represent different clusters. g, The ratio of the 13C enrichment calculated from the imputed metabolites abundance of sample 1 from sample 2 and detected metabolites abundance of kidney sample 2 in the 29 cell clusters. Dots represent different clusters. h, MALDI-MSI data from measurements of two different kidneys, which were incubated with U-13C6-glucose for 2 h, were used to test the performance of the imputation between different measurements. i, Spearman’s correlation analysis on the imputed and detected metabolites production based on all the pixels. Dots represent different metabolites. j, Spearman’s correlation analysis on the average value of each cluster between the imputed and detected metabolites abundance. Dots represent different metabolites. All the performance test were done on 3 different imputations from different biological independent samples.

