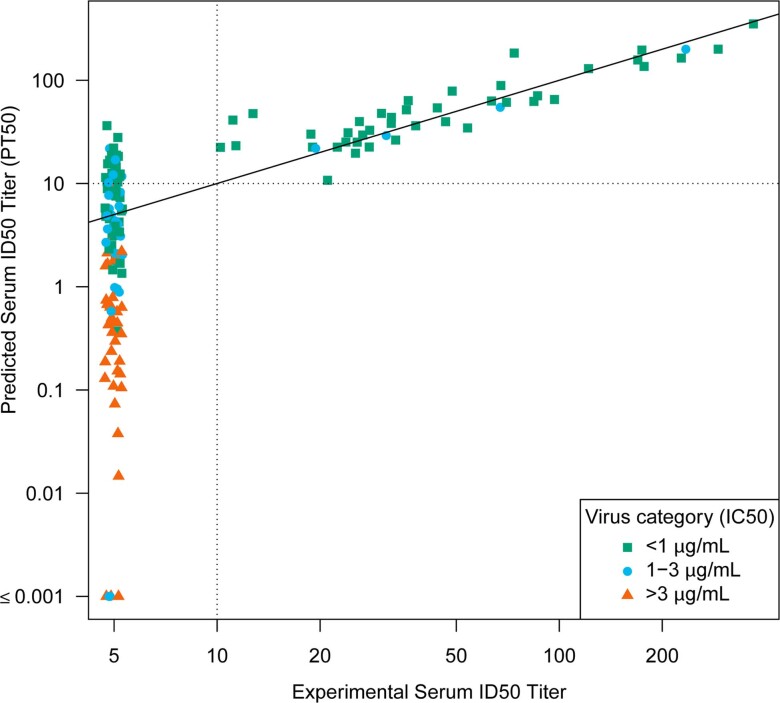
Extended Data Fig. 4. Agreement between predicted vs experimental serum neutralization ID50 titer.
Sera from samples from the last visit (and for a subset from the last two last visits) prior to the first positive HIV-1 RNA PCR test were assayed against autologous isolates from 64 VRC01 recipients who acquired HIV-1 infection (cases) (90 isolates, 164 titers). Predicted serum ID50 titer (PT50) values are plotted against the experimental ID50 for each sample and each isolate [Lin’s concordance correlation coefficient33 = 0.92 (95% CI 0.80 to 0.97)]. PT50 was calculated as popPK model-predicted concentration divided by IC50. Thirty-two of 164 experimental ID50 titers were below the limit of detection when the PT50 was greater than 10 (range 10.2 to 36.3). Zero of 164 experimental ID50 titers was at or above the limit of detection when the PT50 was less than 10. Dashed horizontal and vertical lines at a value of 10 show the experimental ID50 limit of detection; concordance of predicted vs. experimental values above vs. below 10 was 132 of 164 (80.5%).

