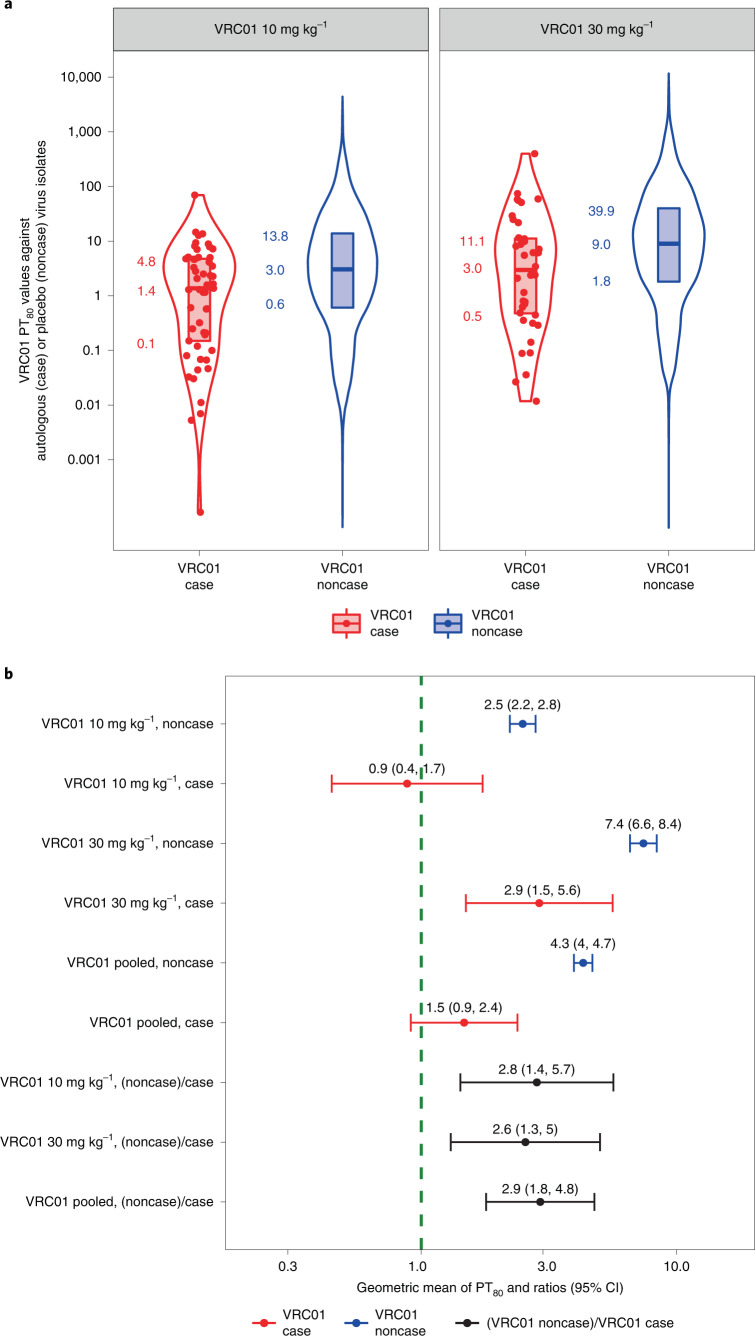
Fig. 5. PT80 values to autologous acquired viruses at HIV-1 acquisition among VRC01 arm cases, and to placebo recipient-acquired viruses among VRC01 arm noncases.
a, Violin plots for VRC01-recipient cases versus noncases, where approach 2 of Huang et al.11 was used to calculate PT80 at a given time point against a given virus. For each VRC01-recipient case, PT80 at the estimated date of HIV-1 acquisition (red dots) was calculated as the estimated VRC01 concentration at acquisition divided by the VRC01 drug product IC80 against the autologous virus. For each of the 82 sampled VRC01-recipient noncases, PT80 at each day of follow-up against each placebo recipient-acquired virus was calculated as the estimated VRC01 concentration divided by VRC01 drug product IC80 against the virus (blue dots). The lower bound, horizontal line and upper bound of the vertical rectangular boxplots show the 25th, 50th and 75th percentiles, respectively. On each side of the boxplot is a kernel density estimation of the distribution shape of PT80. b, By VRC01 dose arm and across dose arms pooled: geometric mean PT80 at HIV-1 acquisition in VRC01-recipient cases against the autologous acquired virus, geometric mean PT80 in VRC01-recipient noncases (their individual-specific medians over follow-up) to placebo recipient-acquired viruses, and their ratio. Error bars represent 95% CIs.

